Fig. 4
Download original image
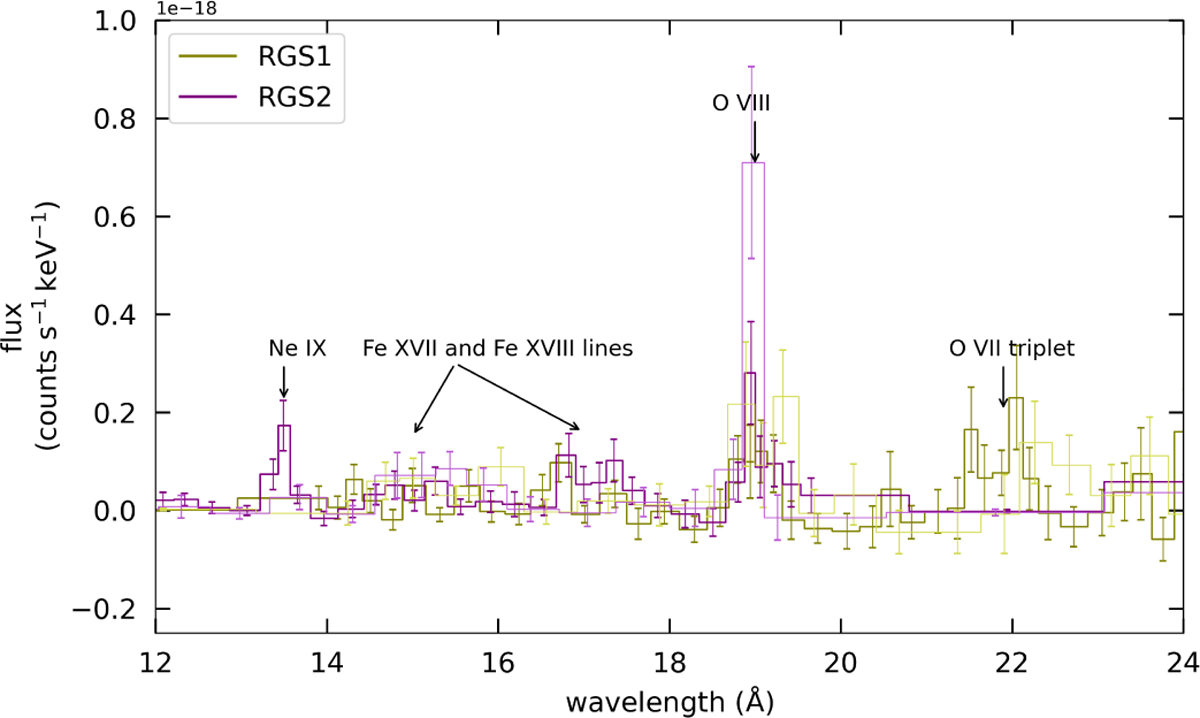
Spectra from the RGS instruments showing flux (counts s−1keV−1) plotted against wavelength (Å), with associated error bars. RGS1 is represented by a green line and RGS2 by a purple line. Vivid colors indicate the original observation 2, while fainter colors represent observation 1. Key spectral lines, including NeIX, FeXVII, FeXVIII, OVIII, and the OVII triplet, are marked with arrows and annotations.
Current usage metrics show cumulative count of Article Views (full-text article views including HTML views, PDF and ePub downloads, according to the available data) and Abstracts Views on Vision4Press platform.
Data correspond to usage on the plateform after 2015. The current usage metrics is available 48-96 hours after online publication and is updated daily on week days.
Initial download of the metrics may take a while.