Fig. 3
Download original image
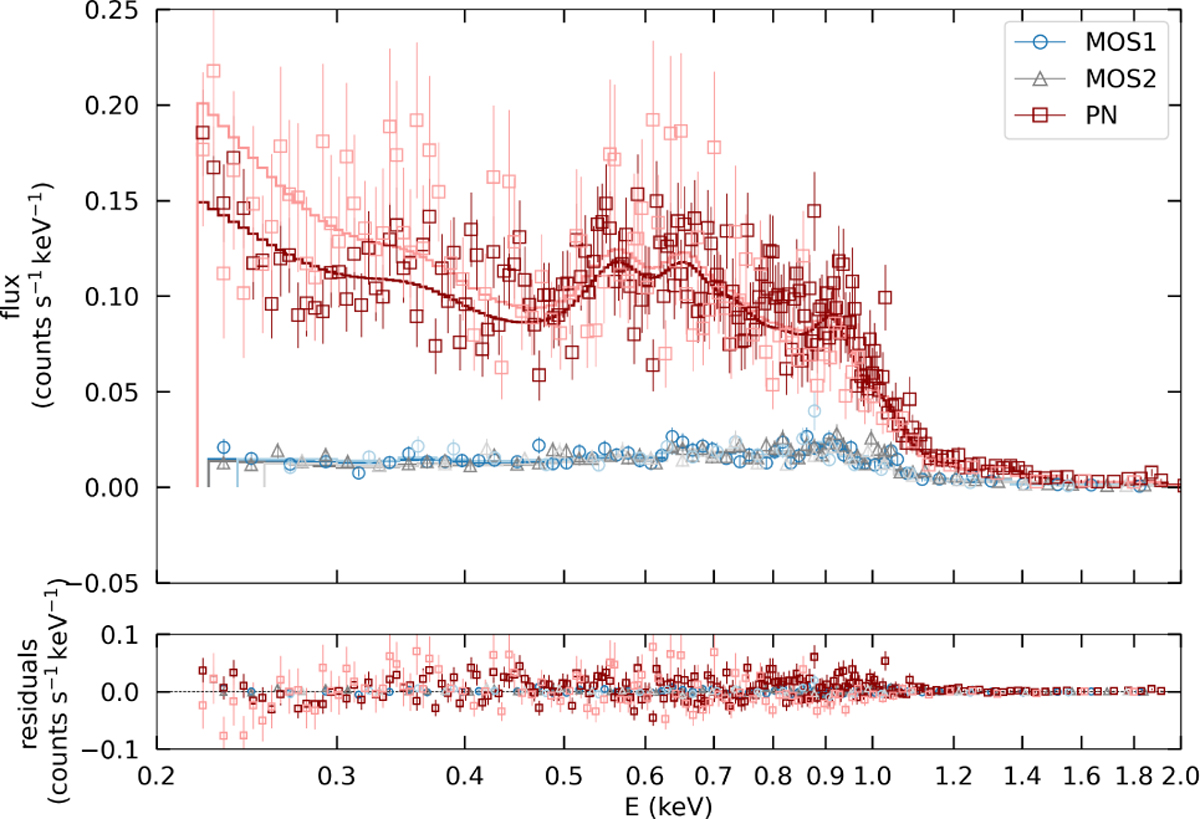
Spectra of the EPIC detector as a function of energy (keV), with MOS1 represented by a blue circle, MOS2 by a gray triangle, and PN by red squares. The residuals of the fits are shown in the bottom row. The spectrum has a soft nature, with an average coronal temperature of 4.21 MK. Vivid colors correspond to the observation 2 quiescent phase, while weak colors represent observation 1.
Current usage metrics show cumulative count of Article Views (full-text article views including HTML views, PDF and ePub downloads, according to the available data) and Abstracts Views on Vision4Press platform.
Data correspond to usage on the plateform after 2015. The current usage metrics is available 48-96 hours after online publication and is updated daily on week days.
Initial download of the metrics may take a while.