Fig. 2
Download original image
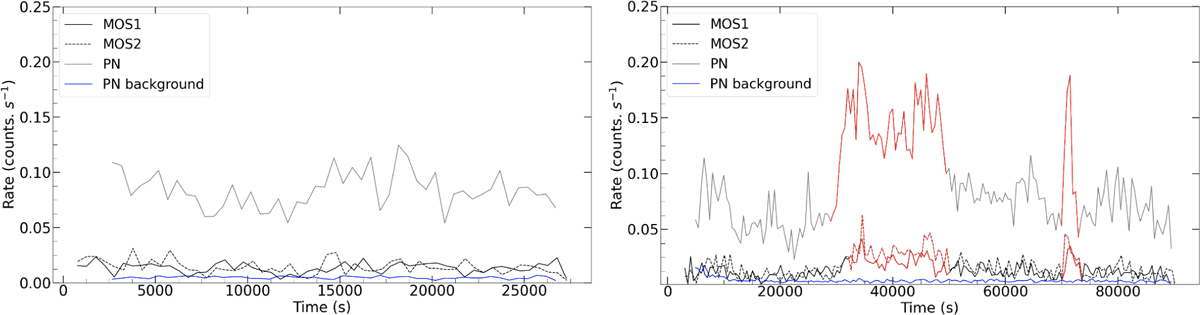
XMM-Newton X-ray light curves of HD 223889, with 500 s time binnning in the energy range 0.2–2 keV. On the left side, we show the signal from the two MOS detectors and the PN signal for observation 1, while on the right side, we show the signals from observation 2. In both panels we show the PN-background and background-subtracted light curves. The gray line represents the light curve of the PN detector, while the solid-black line and dashed black line correspond to MOS1 and MOS2, respectively. The PN-background is represented in blue. The red lines in the right panel represent the parts of the observation where we identified flares by visual inspection based on the displayed elevated count rates.
Current usage metrics show cumulative count of Article Views (full-text article views including HTML views, PDF and ePub downloads, according to the available data) and Abstracts Views on Vision4Press platform.
Data correspond to usage on the plateform after 2015. The current usage metrics is available 48-96 hours after online publication and is updated daily on week days.
Initial download of the metrics may take a while.