Fig. 7
Download original image
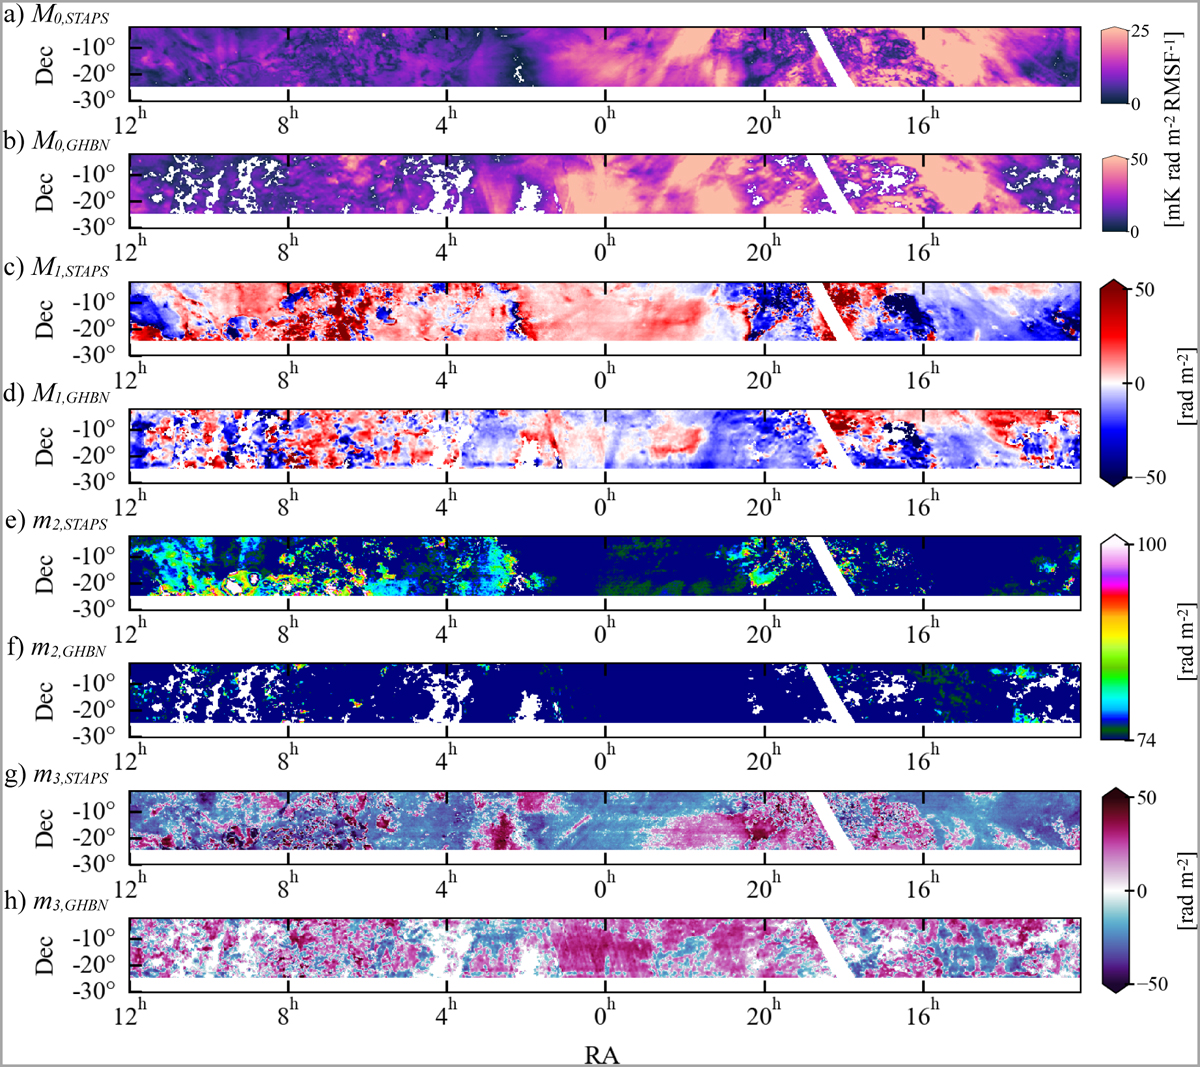
Moment maps of the overlap region. From top to bottom: (a) M0,STAPS; (b) M0,GHBN; (c) M1,STAPS; M1,GHBN; (e) m2,STAPS; (f) m2,GHBN; (g) m3,STAPS; (h) m3,GHBN. The white areas show either the masked values or the value of zero. The color bars are saturated to present the finer details of structures, and the M0 color maps specifically are saturated at 50% of the maximum.
Current usage metrics show cumulative count of Article Views (full-text article views including HTML views, PDF and ePub downloads, according to the available data) and Abstracts Views on Vision4Press platform.
Data correspond to usage on the plateform after 2015. The current usage metrics is available 48-96 hours after online publication and is updated daily on week days.
Initial download of the metrics may take a while.