Fig. 6
Download original image
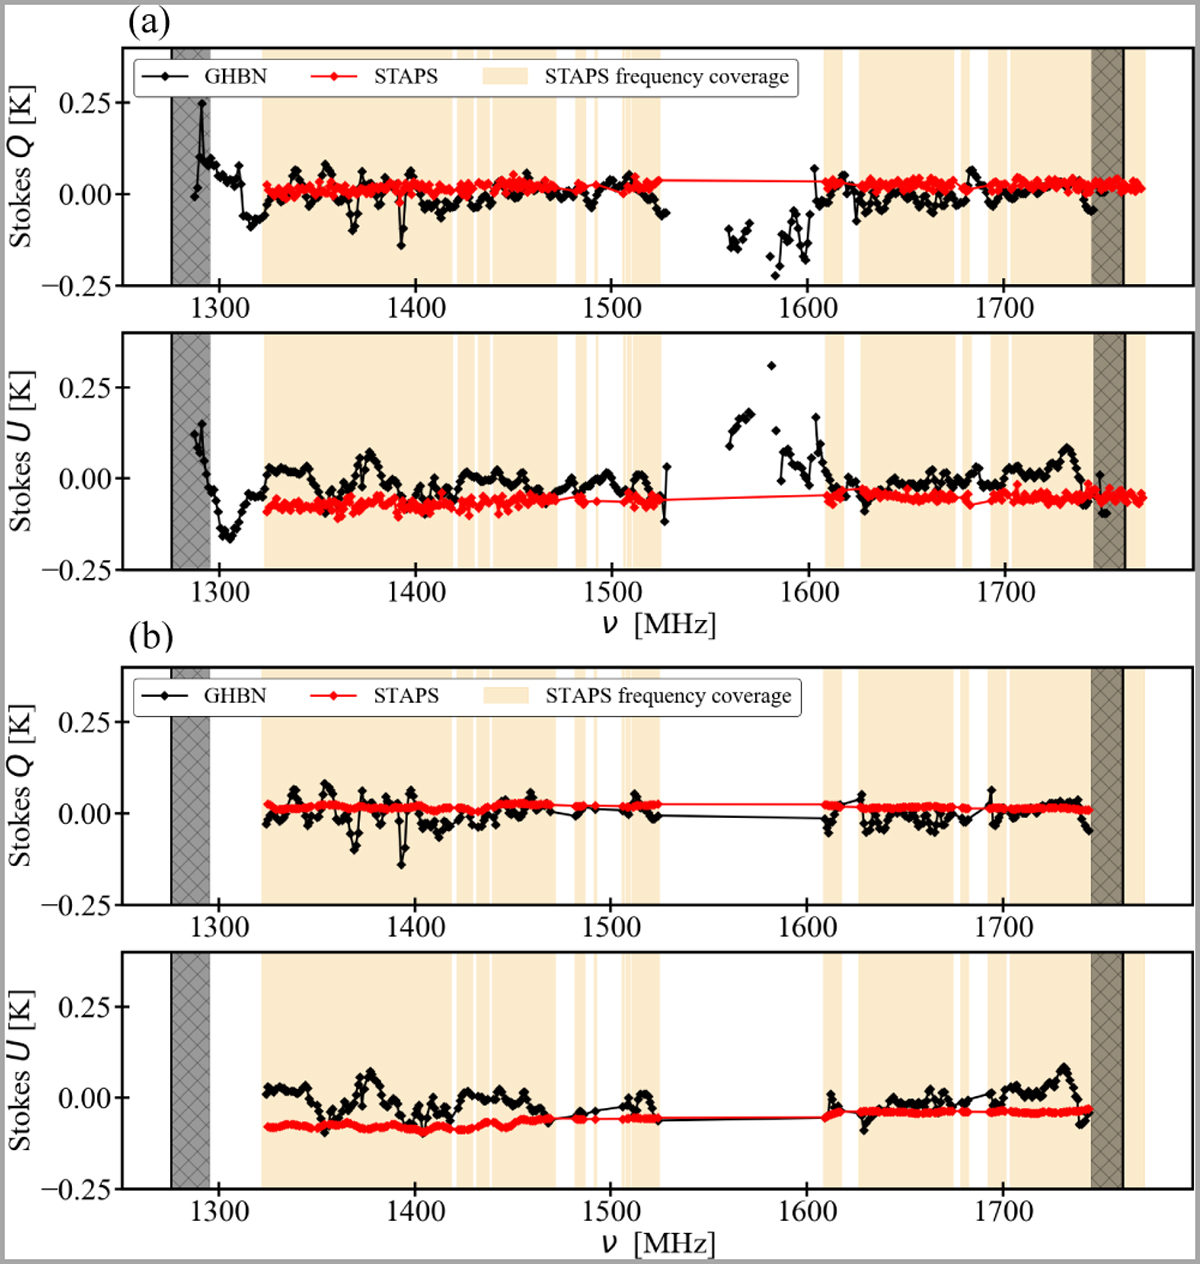
Representation of the frequency coverage of STAPS and GHBN at the Galactic location of l = 310°.2, b = 52°.5. The top panel plots (a) present the original Stokes Q and U of STAPS and GHBN, and the bottom panel plots (b) present the data modified after the procedure explained in Sect. 5. The area highlighted in yellow represents the STAPS frequency coverage. The hatched gray areas indicate the frequency ranges for which GHBN lacks adequate data in the overlap region for proper comparison. These pixels were discarded in the original data due to the localized RFI, as is described by Ordog (2020).
Current usage metrics show cumulative count of Article Views (full-text article views including HTML views, PDF and ePub downloads, according to the available data) and Abstracts Views on Vision4Press platform.
Data correspond to usage on the plateform after 2015. The current usage metrics is available 48-96 hours after online publication and is updated daily on week days.
Initial download of the metrics may take a while.