Fig. 3
Download original image
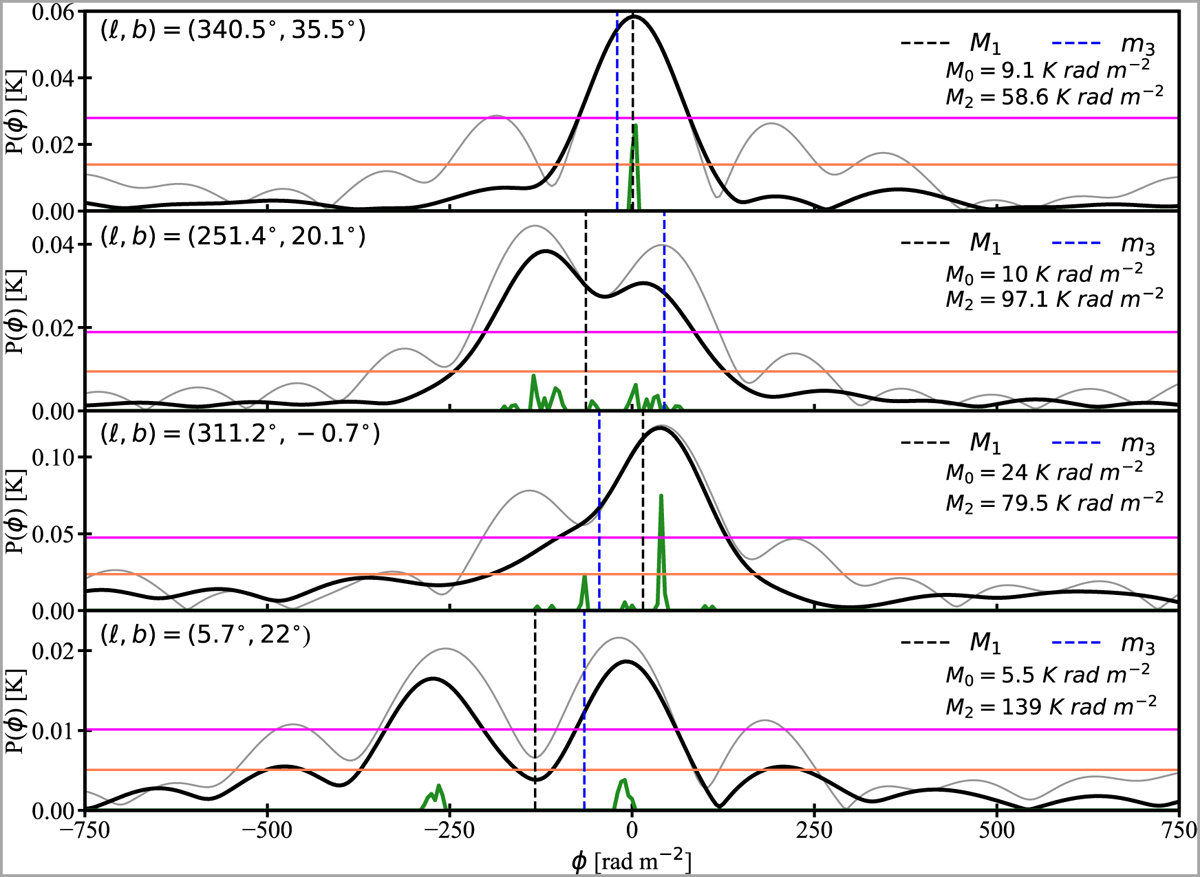
Faraday spectra of four sample pixels in STAPS. The orange line represents the 3σ RM-CLEAN cutoff limit. The purple line shows the 6σ intensity limit applied during Faraday moment calculations. The gray line represents the dirty Faraday depth spectrum. The black line presents the RM-CLEANed Faraday depth spectrum, and the RM-CLEAN model components (CC) are shown in green. The Galactic coordinates of the pixels from which the spectra were taken are shown in the top left of the panels. The legends in the top right show the Faraday moment results for the related pixels. We note the different scales on the y axis in each plot.
Current usage metrics show cumulative count of Article Views (full-text article views including HTML views, PDF and ePub downloads, according to the available data) and Abstracts Views on Vision4Press platform.
Data correspond to usage on the plateform after 2015. The current usage metrics is available 48-96 hours after online publication and is updated daily on week days.
Initial download of the metrics may take a while.