Open Access
Fig. 2
Download original image
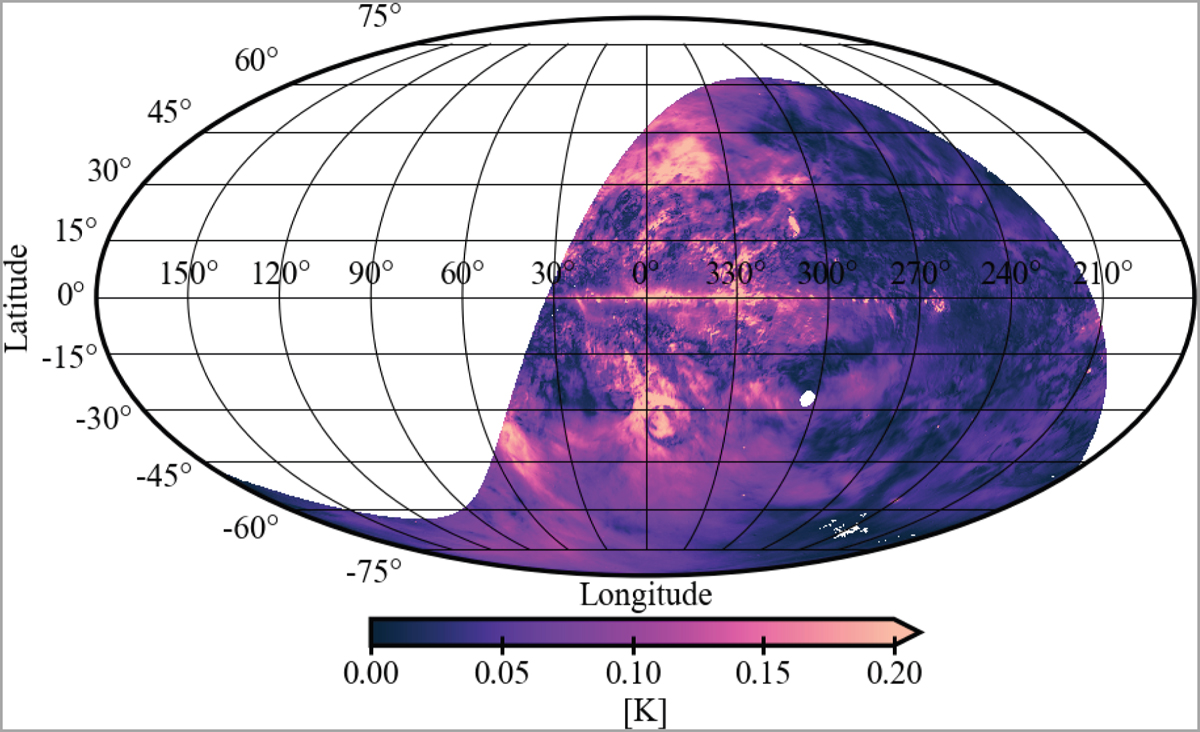
Ppeak map of STAPS shown in Mollweide projection. The white areas are either outside the survey coverage, or masked pixels where S/N < 6. The color bar is saturated for presentation clarity.
Current usage metrics show cumulative count of Article Views (full-text article views including HTML views, PDF and ePub downloads, according to the available data) and Abstracts Views on Vision4Press platform.
Data correspond to usage on the plateform after 2015. The current usage metrics is available 48-96 hours after online publication and is updated daily on week days.
Initial download of the metrics may take a while.