Open Access
Fig. 12
Download original image
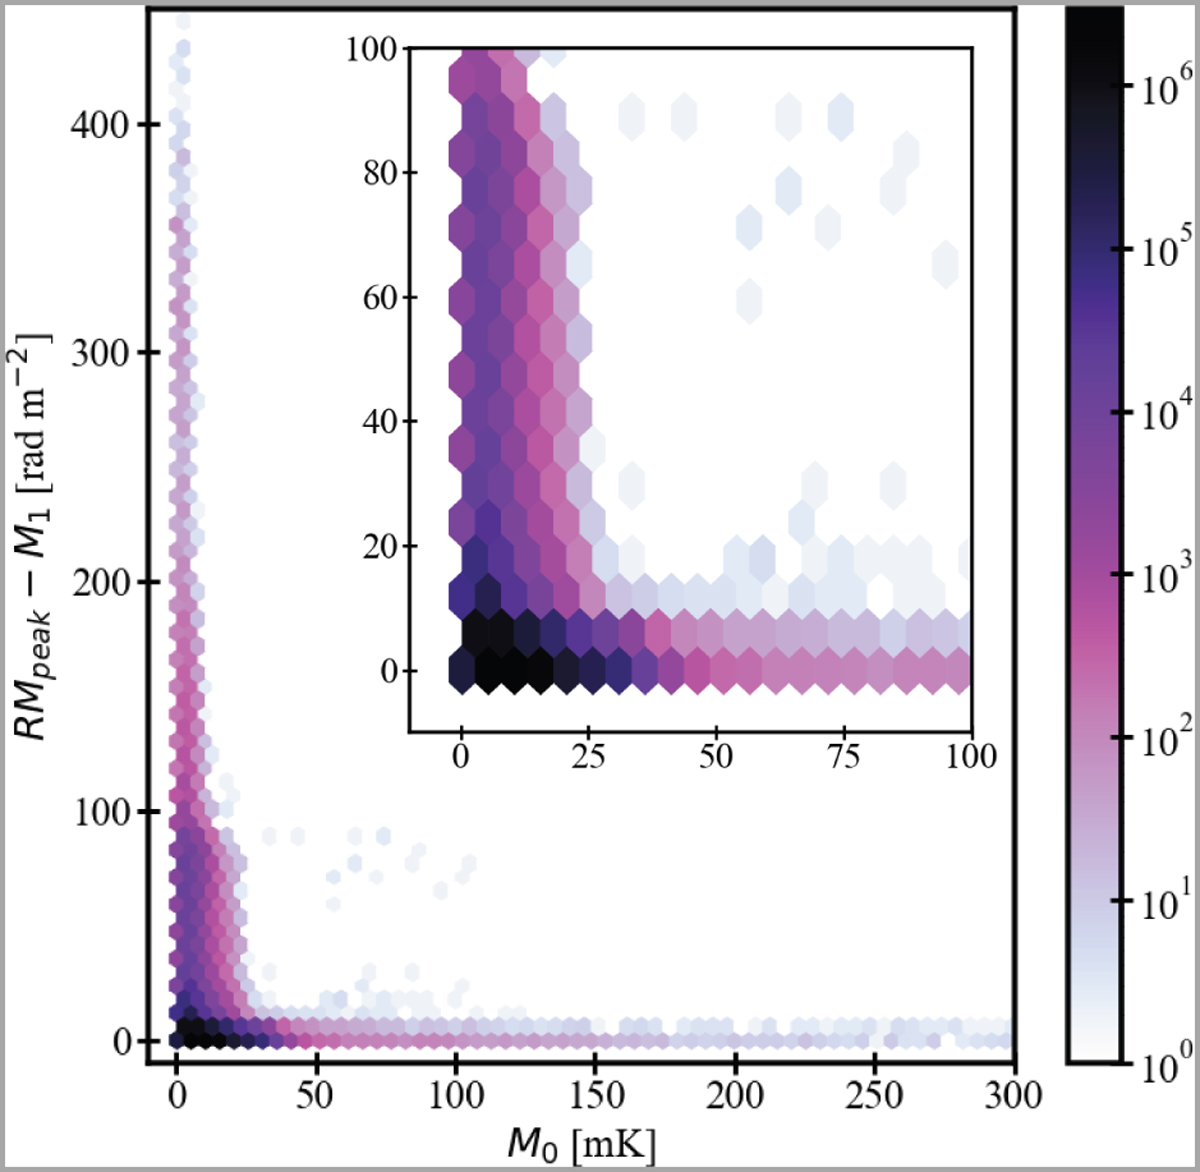
Comparison between |ϕpeak − M1| and M0. The inner panel shows the values zoomed in between (ϕpeak − M1) < 100 rad m−2 and M0 < 100 mK. The Galactic plane (−6° < b < 5°) and discrete objects such as Sh 2–27 and G353–34 are excluded. The color bar corresponds to the number of data points in each hexbin.
Current usage metrics show cumulative count of Article Views (full-text article views including HTML views, PDF and ePub downloads, according to the available data) and Abstracts Views on Vision4Press platform.
Data correspond to usage on the plateform after 2015. The current usage metrics is available 48-96 hours after online publication and is updated daily on week days.
Initial download of the metrics may take a while.