Open Access
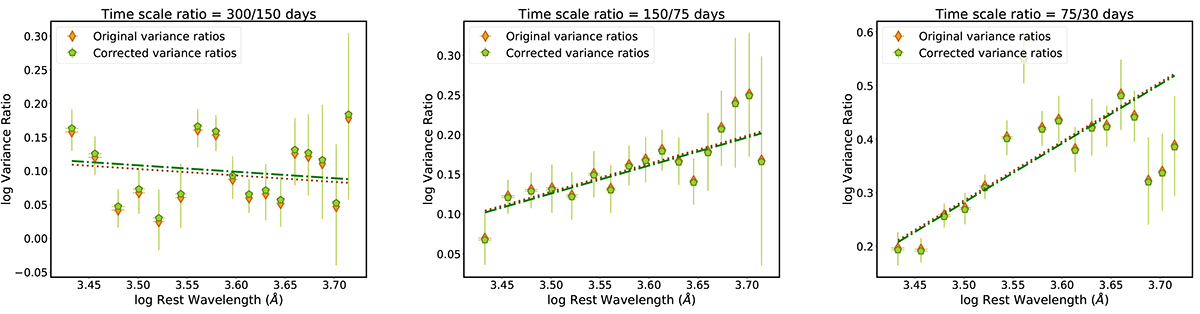
Fig. 4.
Download original image
Quasar variance ratios as a function of rest-frame wavelength. The median variance ratios are shown with gold diamonds. Green pentagons denote values corrected for spectral suppression. The error bars correspond to the root-mean-squared scatter of the median variance ratio. Linear fits are shown using lines.
Current usage metrics show cumulative count of Article Views (full-text article views including HTML views, PDF and ePub downloads, according to the available data) and Abstracts Views on Vision4Press platform.
Data correspond to usage on the plateform after 2015. The current usage metrics is available 48-96 hours after online publication and is updated daily on week days.
Initial download of the metrics may take a while.