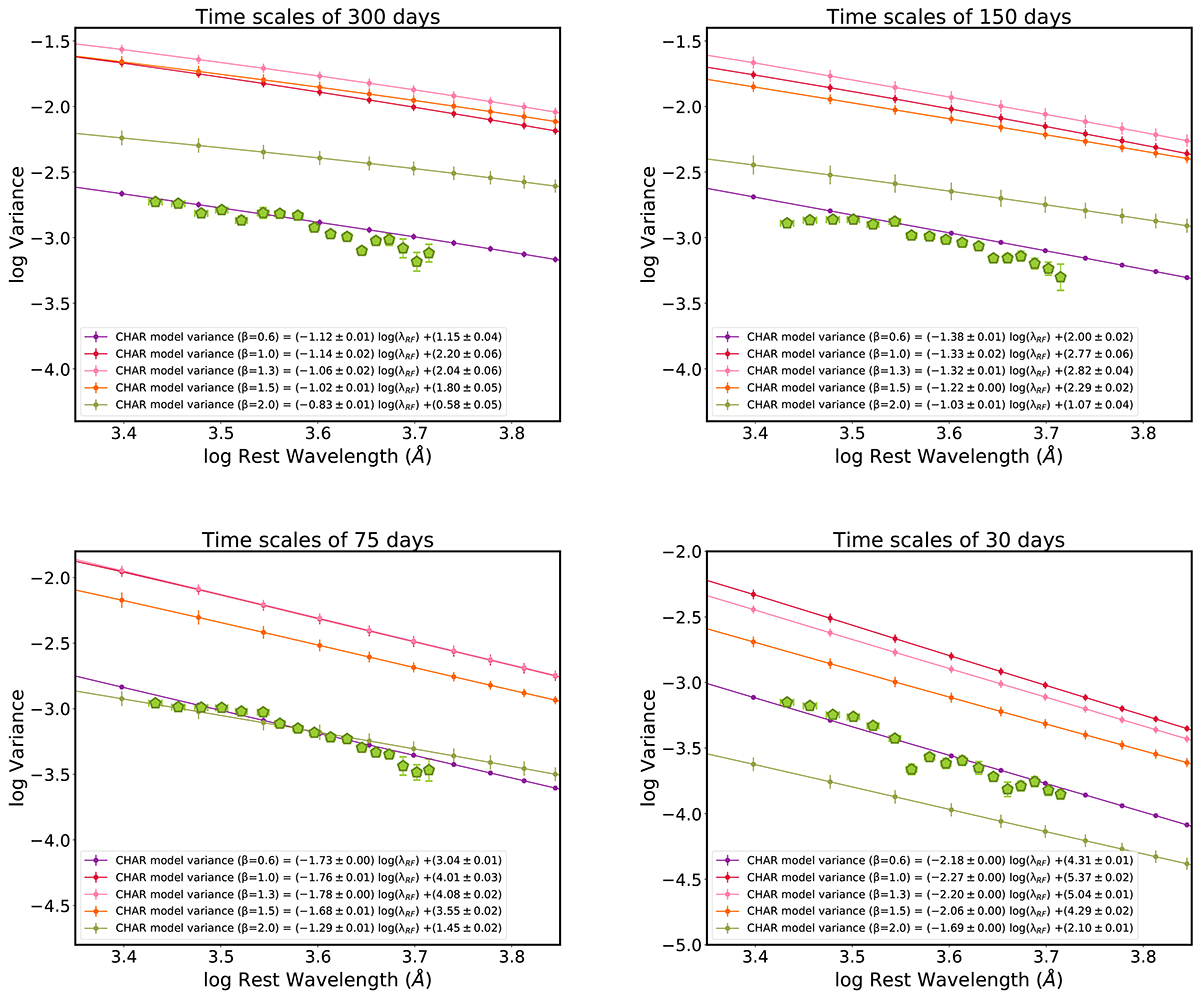
Fig. C.1.
Download original image
The variance-wavelength relationship for the CHAR model for four timescales exploring a PSD ∝1/fβ with β ranging from 0.6 to 2. The plots display multiple linear regressions, as indicated in the legends, showing the influence of different PSDs on the model behavior. Green pentagons represent observed median ZTF variance values, with error bars indicating root-mean-squared scatter.
Current usage metrics show cumulative count of Article Views (full-text article views including HTML views, PDF and ePub downloads, according to the available data) and Abstracts Views on Vision4Press platform.
Data correspond to usage on the plateform after 2015. The current usage metrics is available 48-96 hours after online publication and is updated daily on week days.
Initial download of the metrics may take a while.