Open Access
Fig. A.1.
Download original image
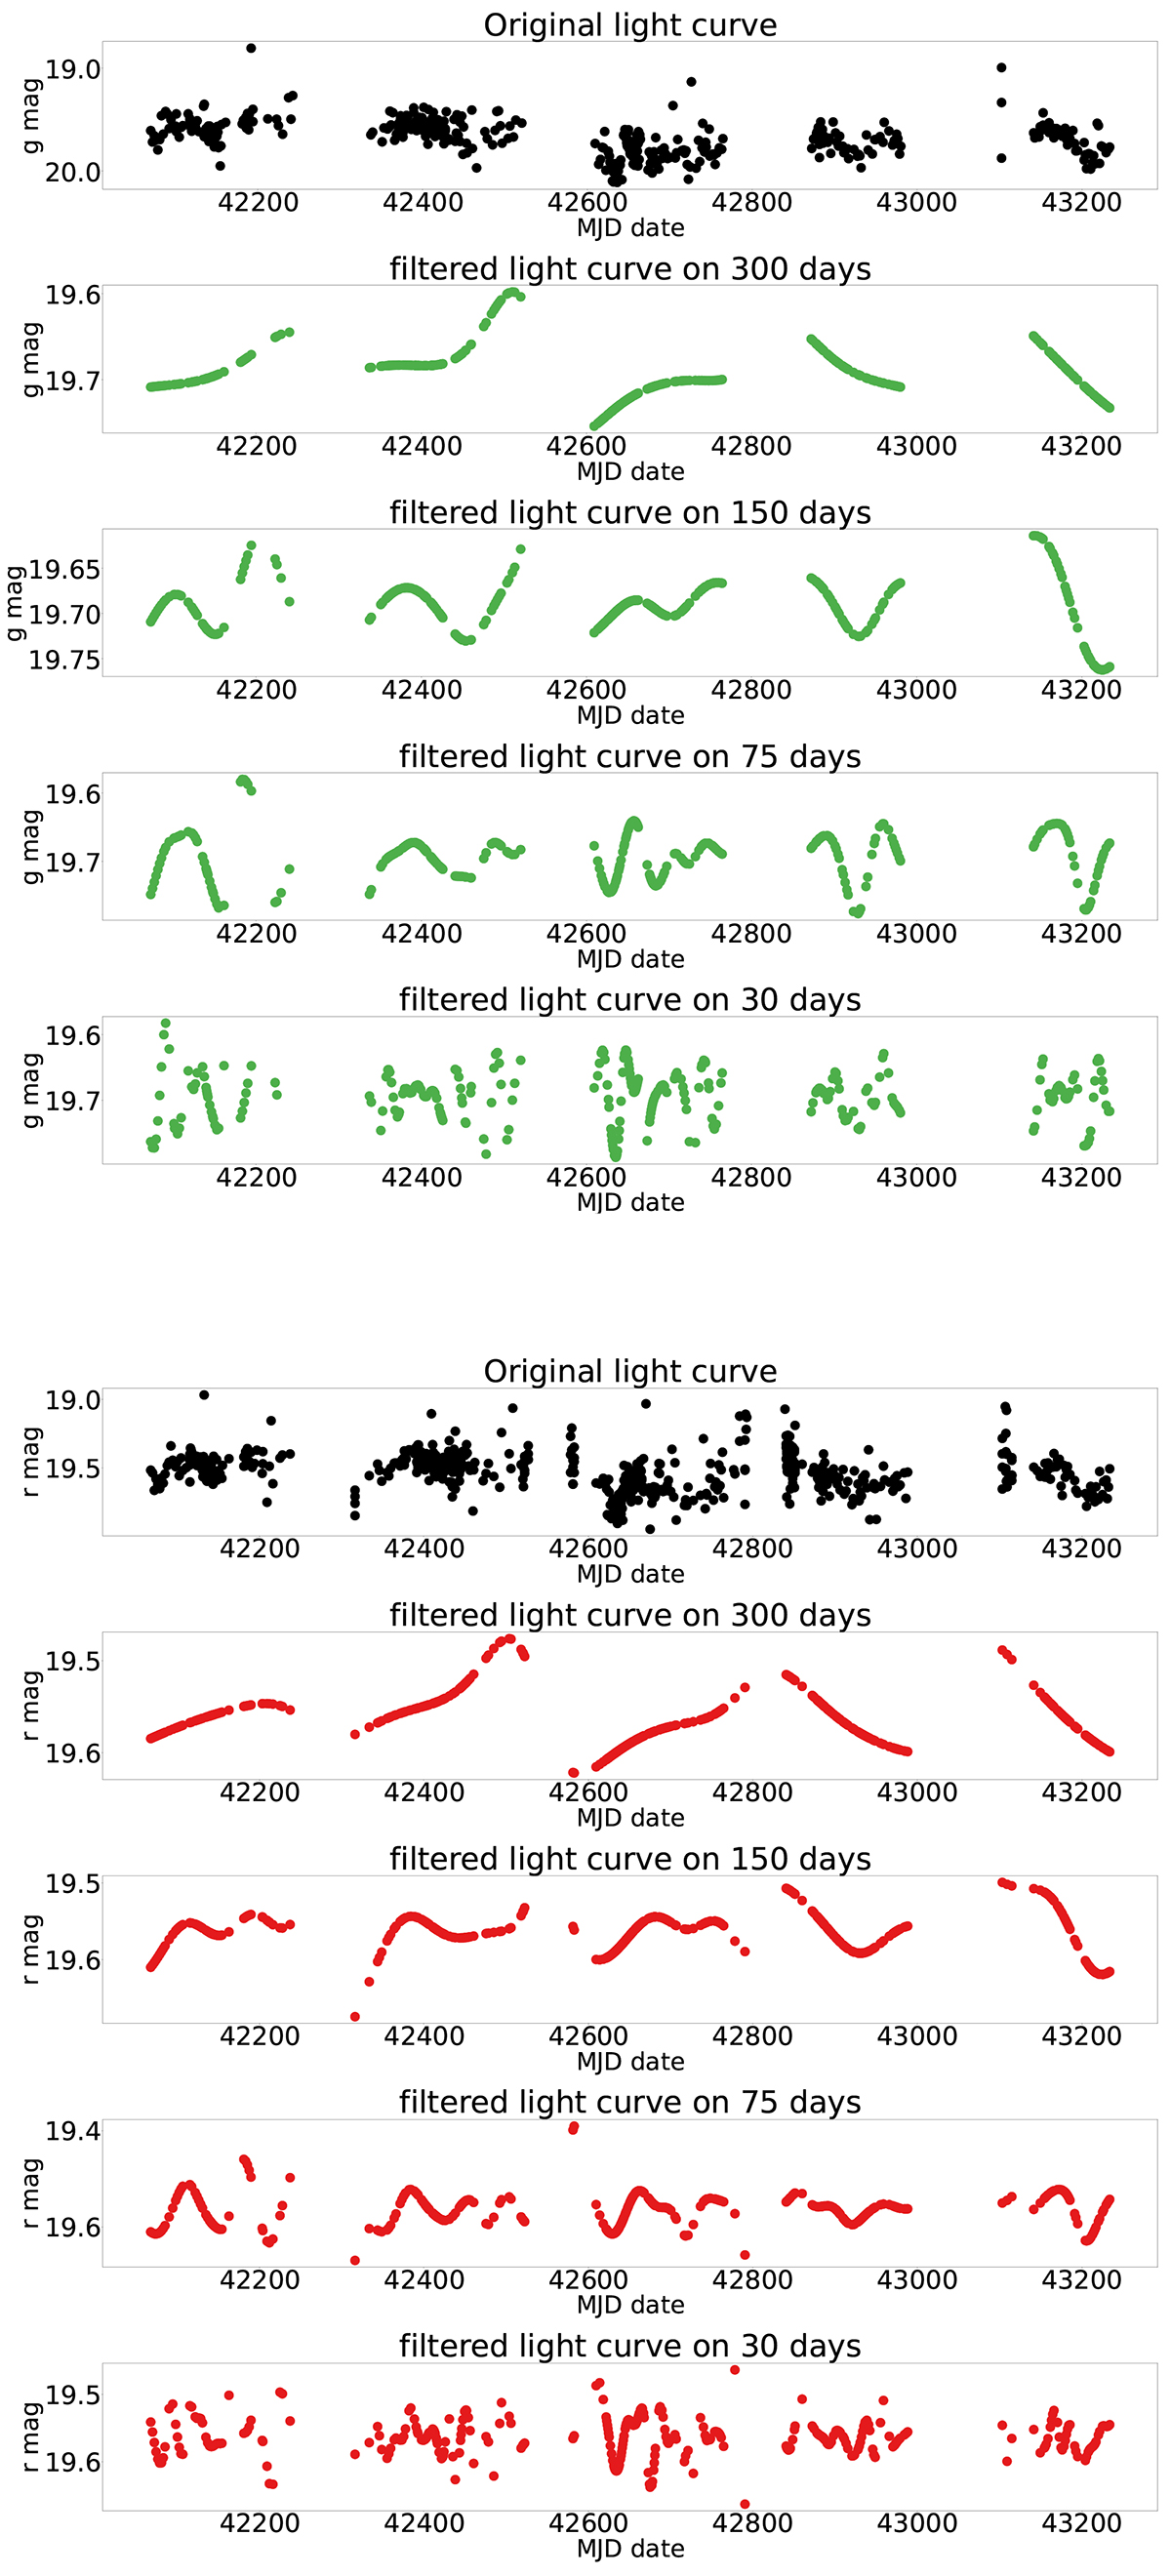
The top panel displays the original g-band light curve, while the filtered light curves at the four studied timescales are shown beneath it. Similarly, the bottom panel shows the original r-band light curve, with filtered light curves at the same timescales arranged from top to bottom.
Current usage metrics show cumulative count of Article Views (full-text article views including HTML views, PDF and ePub downloads, according to the available data) and Abstracts Views on Vision4Press platform.
Data correspond to usage on the plateform after 2015. The current usage metrics is available 48-96 hours after online publication and is updated daily on week days.
Initial download of the metrics may take a while.