Fig. D.2.
Download original image
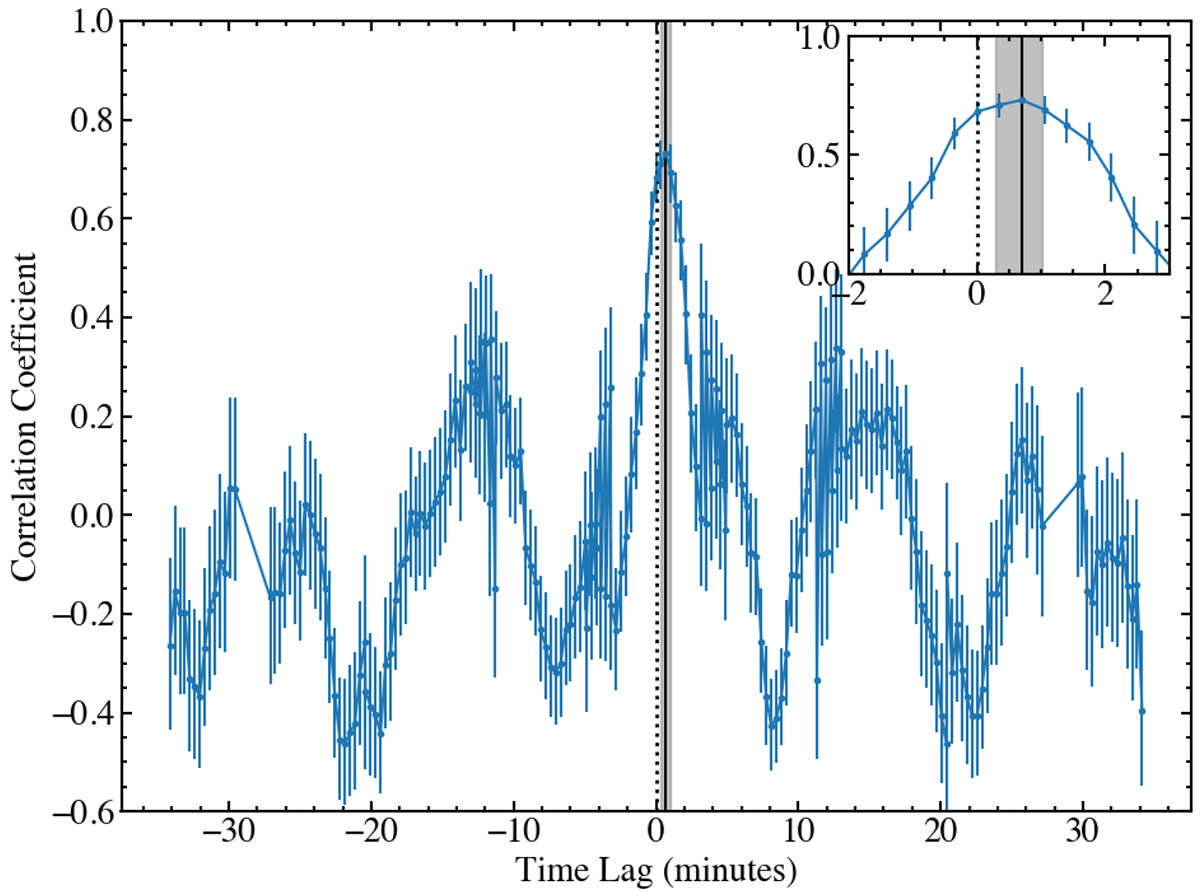
Cross-correlation function calculated with the ZDCF algorithm. We include the full range of time lags and a zoomed-in plot highlighting the peak lag. The solid vertical line and grey region show the best fit time lag and 1σ uncertainties, respectively. The vertical dashed line shows the zero-lag position, offset from the best-fit lag at a 1.8σ significance.
Current usage metrics show cumulative count of Article Views (full-text article views including HTML views, PDF and ePub downloads, according to the available data) and Abstracts Views on Vision4Press platform.
Data correspond to usage on the plateform after 2015. The current usage metrics is available 48-96 hours after online publication and is updated daily on week days.
Initial download of the metrics may take a while.