Fig. D.1.
Download original image
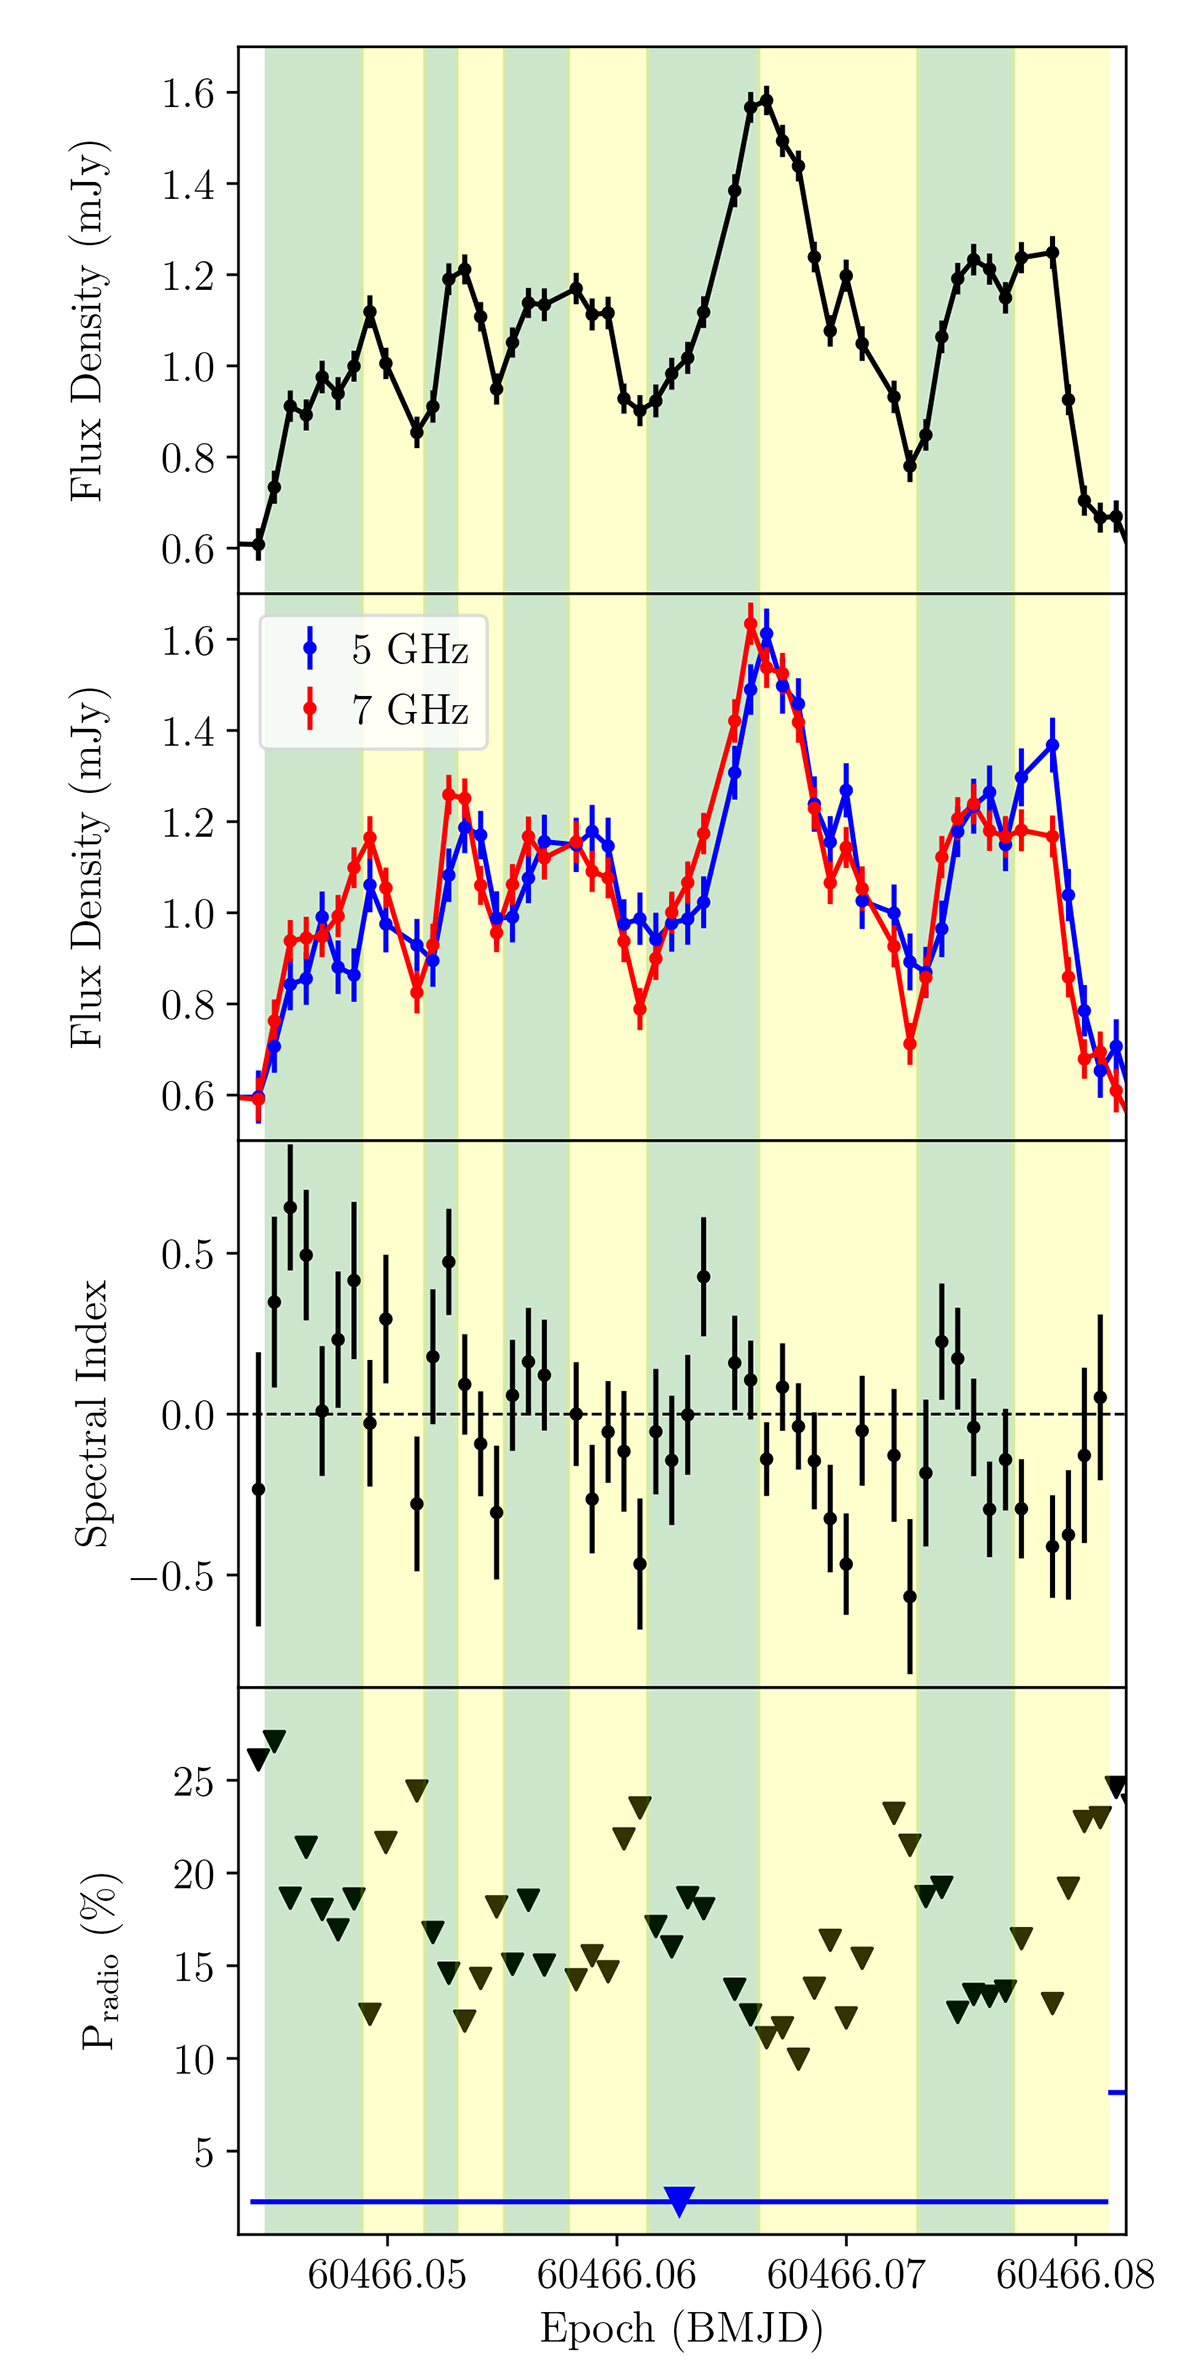
Top: VLA 6 GHz light-curve of J1023 from the June 2024 observation during the flaring period, with 1-minute time binning. The radio emission shows multiple flares of similar duration, with green and yellow regions indicating flux rise and decay phases, respectively. Second panel: The same light-curve split into two sub-bands centred on 5 and 7 GHz. Third panel: Evolution of the in-band spectral index α on 1-minute time scale. Here the radio flux density follows Sν ∝ να. Rising phases display flat-to-inverted spectra, while decay phases are generally optically thin. Bottom: Time-resolved and integrated upper limit on the linear polarisation fraction of the radio emission.
Current usage metrics show cumulative count of Article Views (full-text article views including HTML views, PDF and ePub downloads, according to the available data) and Abstracts Views on Vision4Press platform.
Data correspond to usage on the plateform after 2015. The current usage metrics is available 48-96 hours after online publication and is updated daily on week days.
Initial download of the metrics may take a while.