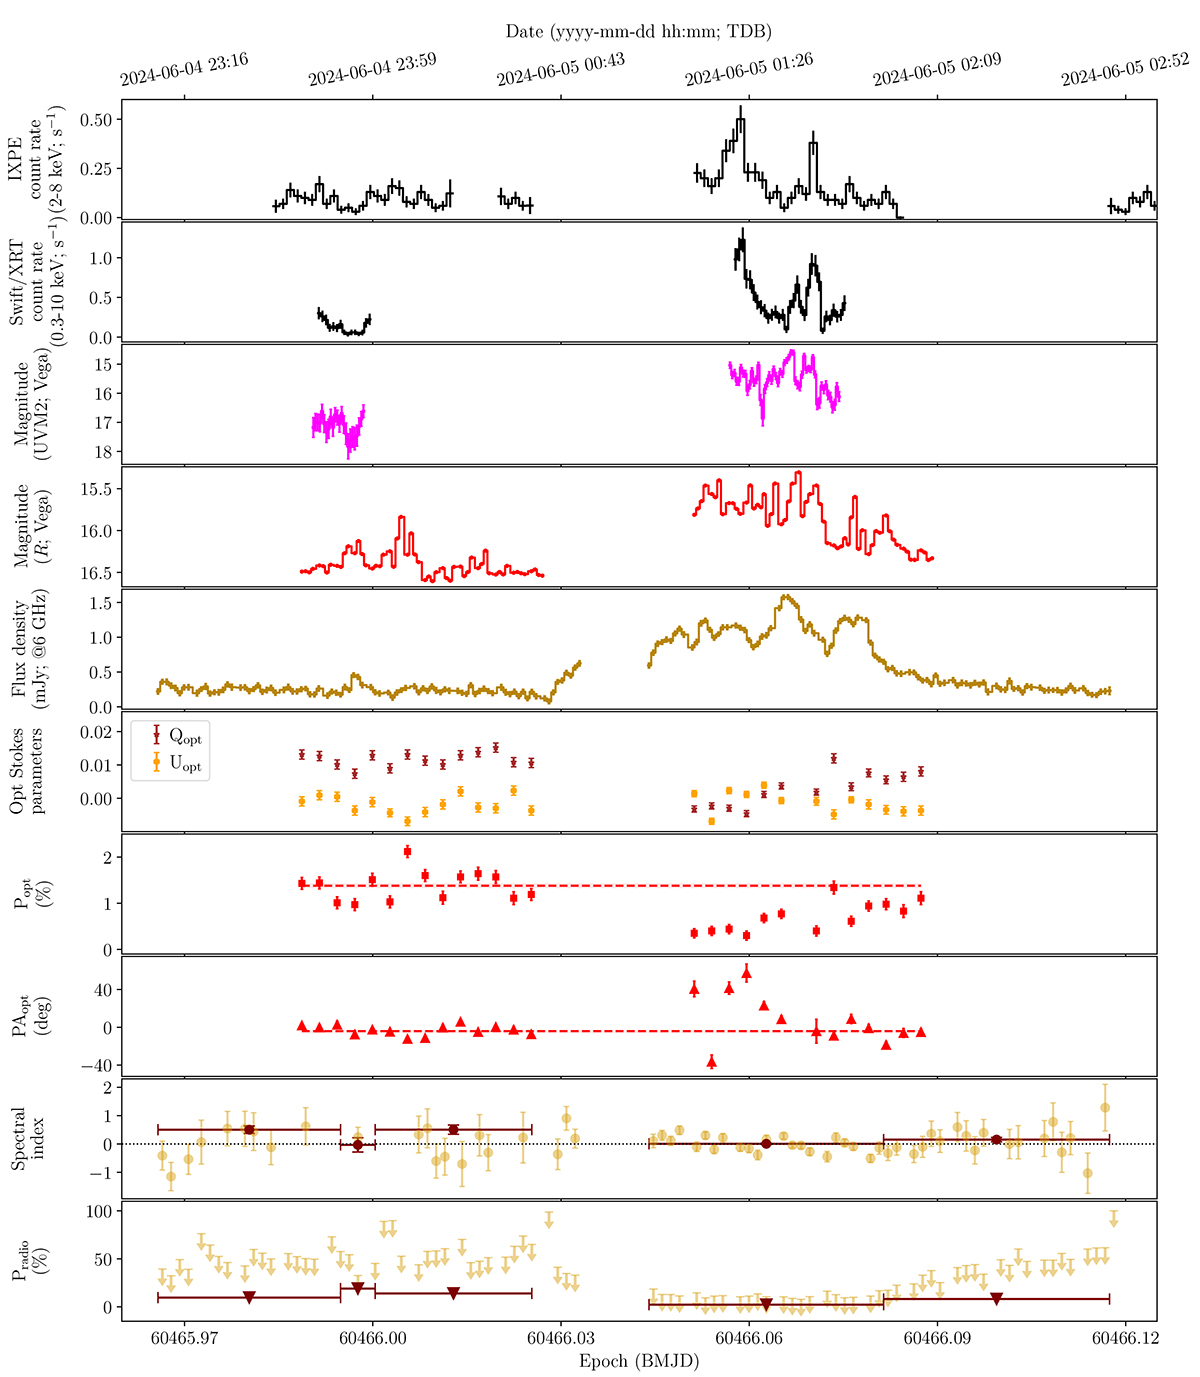
Fig. 1.
Download original image
Multi-band time series and evolution of optical and radio parameters (including data presented by Baglio et al. 2024). Error bars represent the 1σ confidence levels. In the seventh and eighth panels, horizontal dashed red lines mark the average optical polarisation degree (Popt) and angle (PAopt), with shaded areas indicating one standard deviation about the mean. In the ninth panel, a horizontal dotted line shows a spectral index of 0 (i.e., a flat spectrum). In the final panel, downward arrows denote 3σ upper limits on the radio polarisation degree (Pradio). TDB stands for barycentric dynamical time.
Current usage metrics show cumulative count of Article Views (full-text article views including HTML views, PDF and ePub downloads, according to the available data) and Abstracts Views on Vision4Press platform.
Data correspond to usage on the plateform after 2015. The current usage metrics is available 48-96 hours after online publication and is updated daily on week days.
Initial download of the metrics may take a while.