Open Access
Fig. B.2.
Download original image
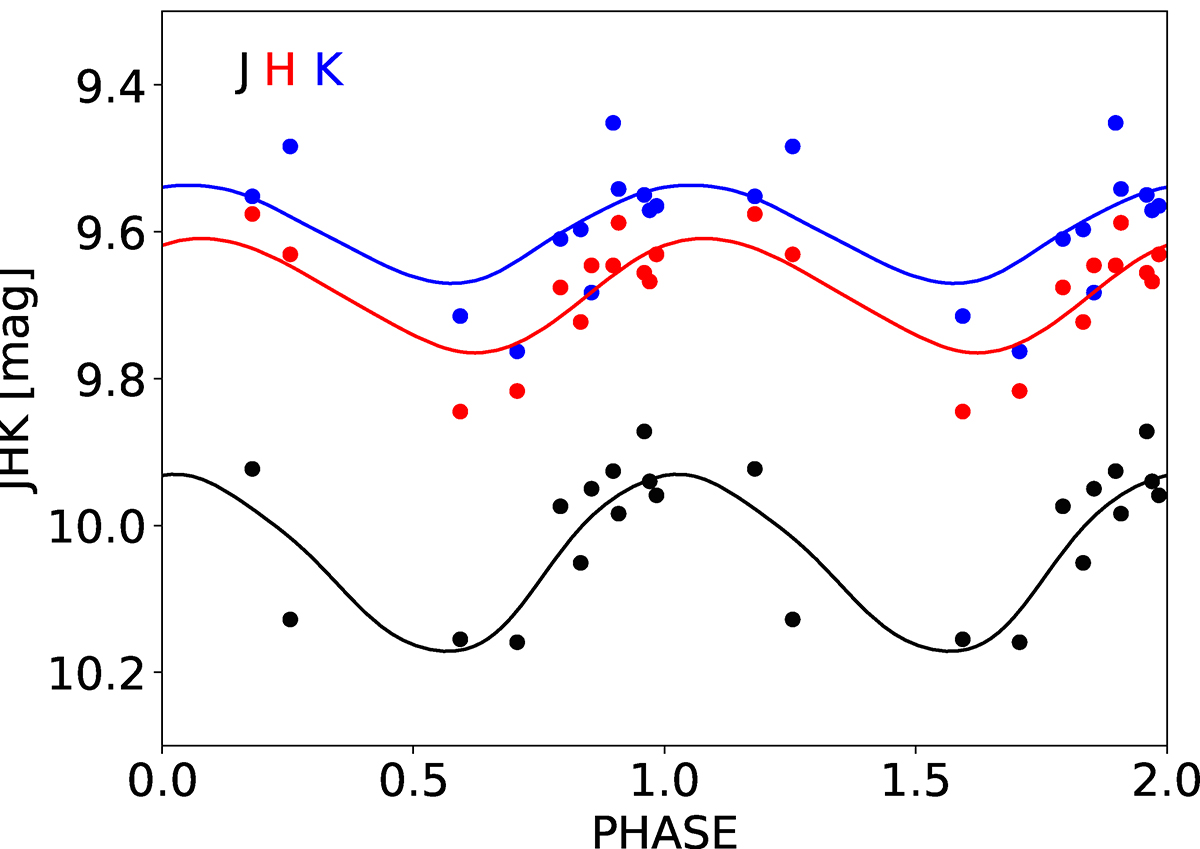
Black, red and blue circles represent the J − ,H− and K− band data for HD 331986 collected with NIC at Nayuta Telescope in November 2021. Solid lines of the same colour represent the light curve templates by Braga et al. (2019), adopted to fit the empirical data.
Current usage metrics show cumulative count of Article Views (full-text article views including HTML views, PDF and ePub downloads, according to the available data) and Abstracts Views on Vision4Press platform.
Data correspond to usage on the plateform after 2015. The current usage metrics is available 48-96 hours after online publication and is updated daily on week days.
Initial download of the metrics may take a while.