Open Access
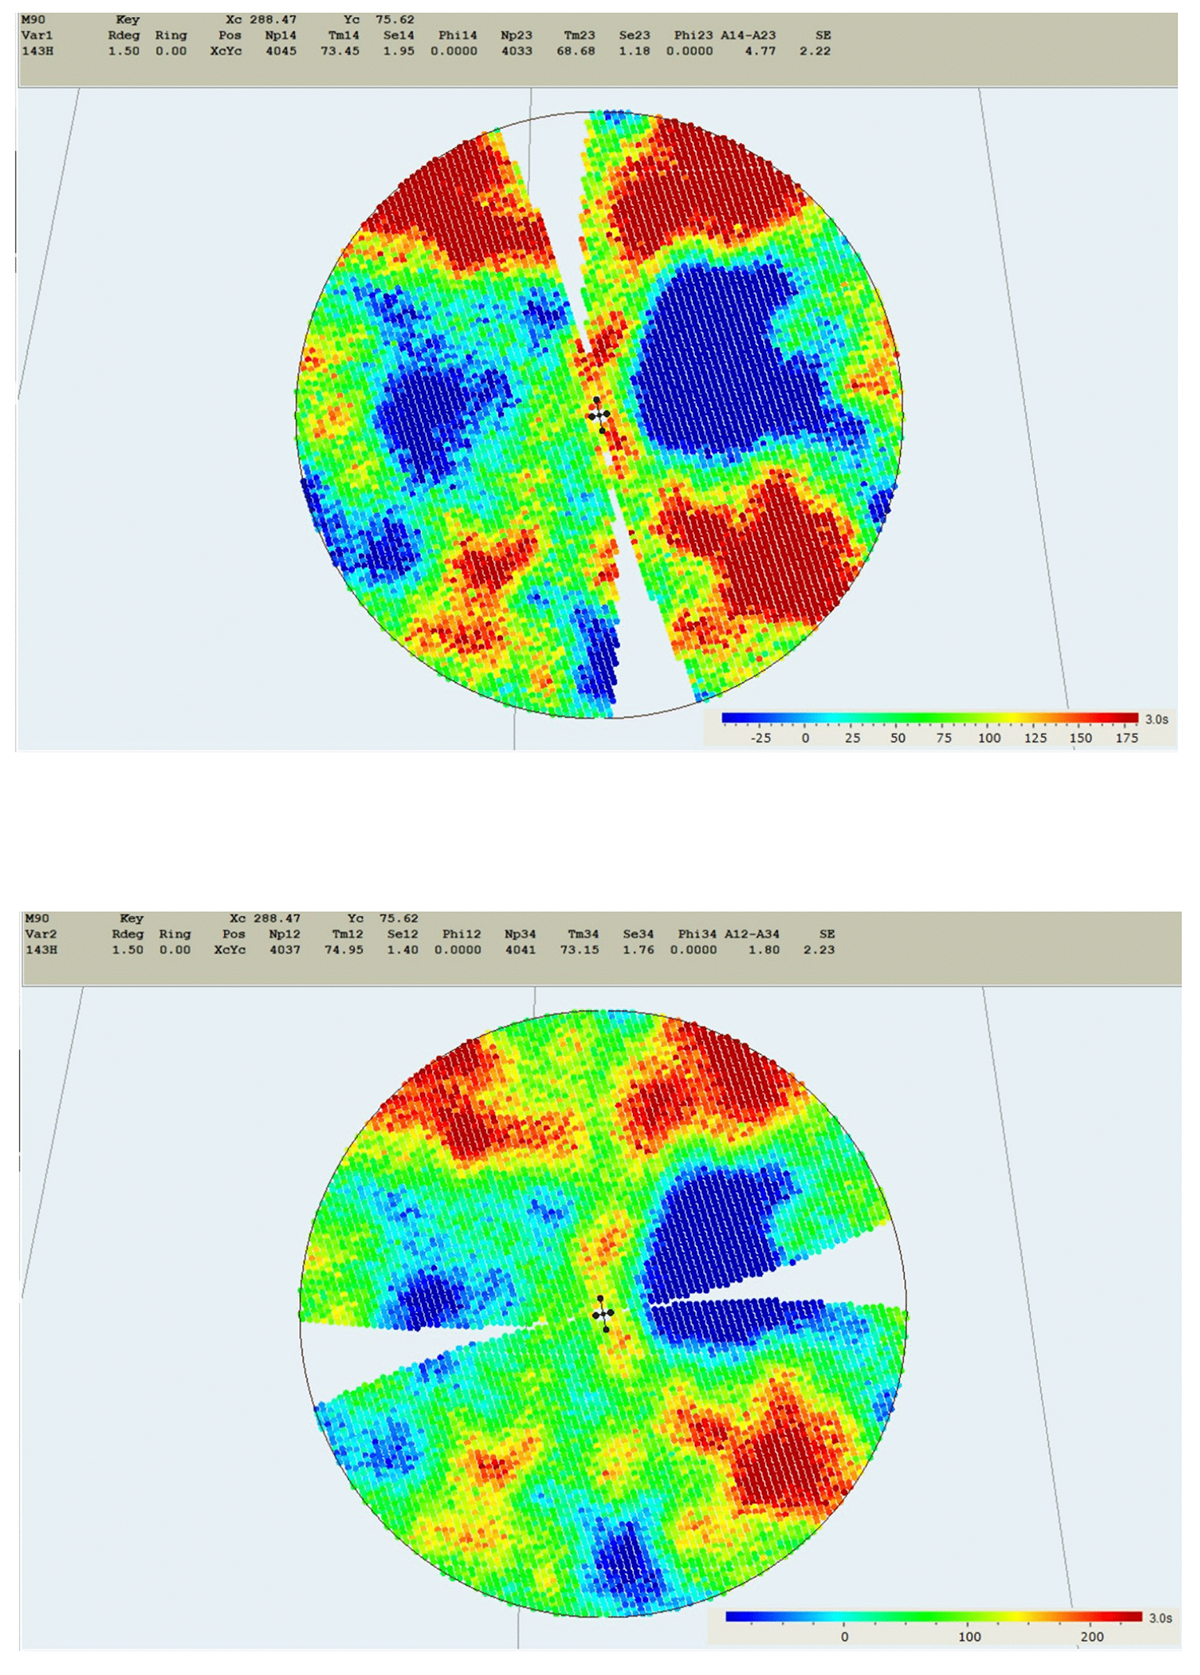
Fig. 3.
Download original image
Upper panel: Planck map at 143 GHZ of quadrants A1 and A4 (right) and A2 and A3 (left), as indicated in Fig. 2. This panel corresponds to V1. Bottom panel: Same as the upper panel but for V2. Regions A1 and A2 are shown in the bottom part of the panel and regions A3 and A4 are in the upper part.
Current usage metrics show cumulative count of Article Views (full-text article views including HTML views, PDF and ePub downloads, according to the available data) and Abstracts Views on Vision4Press platform.
Data correspond to usage on the plateform after 2015. The current usage metrics is available 48-96 hours after online publication and is updated daily on week days.
Initial download of the metrics may take a while.