Fig. 6.
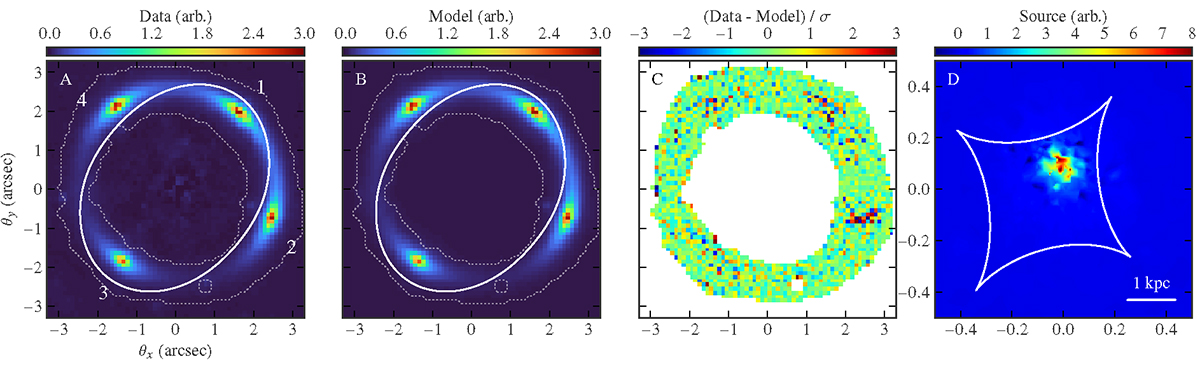
Download original image
Elliptical power-law plus external shear and multipole model of the strongly lensed images. (A) the VIS data with the four lensed images labelled as in Table 3, (B) the maximum a posteriori model, both in arbitrary flux units, (C) the normalised residuals, and (D) the pixellated source reconstruction in the same units as the data and model. Solid curves in the image plane and source plane are the critical curves and caustics respectively. In (A) and (B) the mask used to model the data is indicated by the dotted white shapes. The physical scale in the source plane is indicated.
Current usage metrics show cumulative count of Article Views (full-text article views including HTML views, PDF and ePub downloads, according to the available data) and Abstracts Views on Vision4Press platform.
Data correspond to usage on the plateform after 2015. The current usage metrics is available 48-96 hours after online publication and is updated daily on week days.
Initial download of the metrics may take a while.