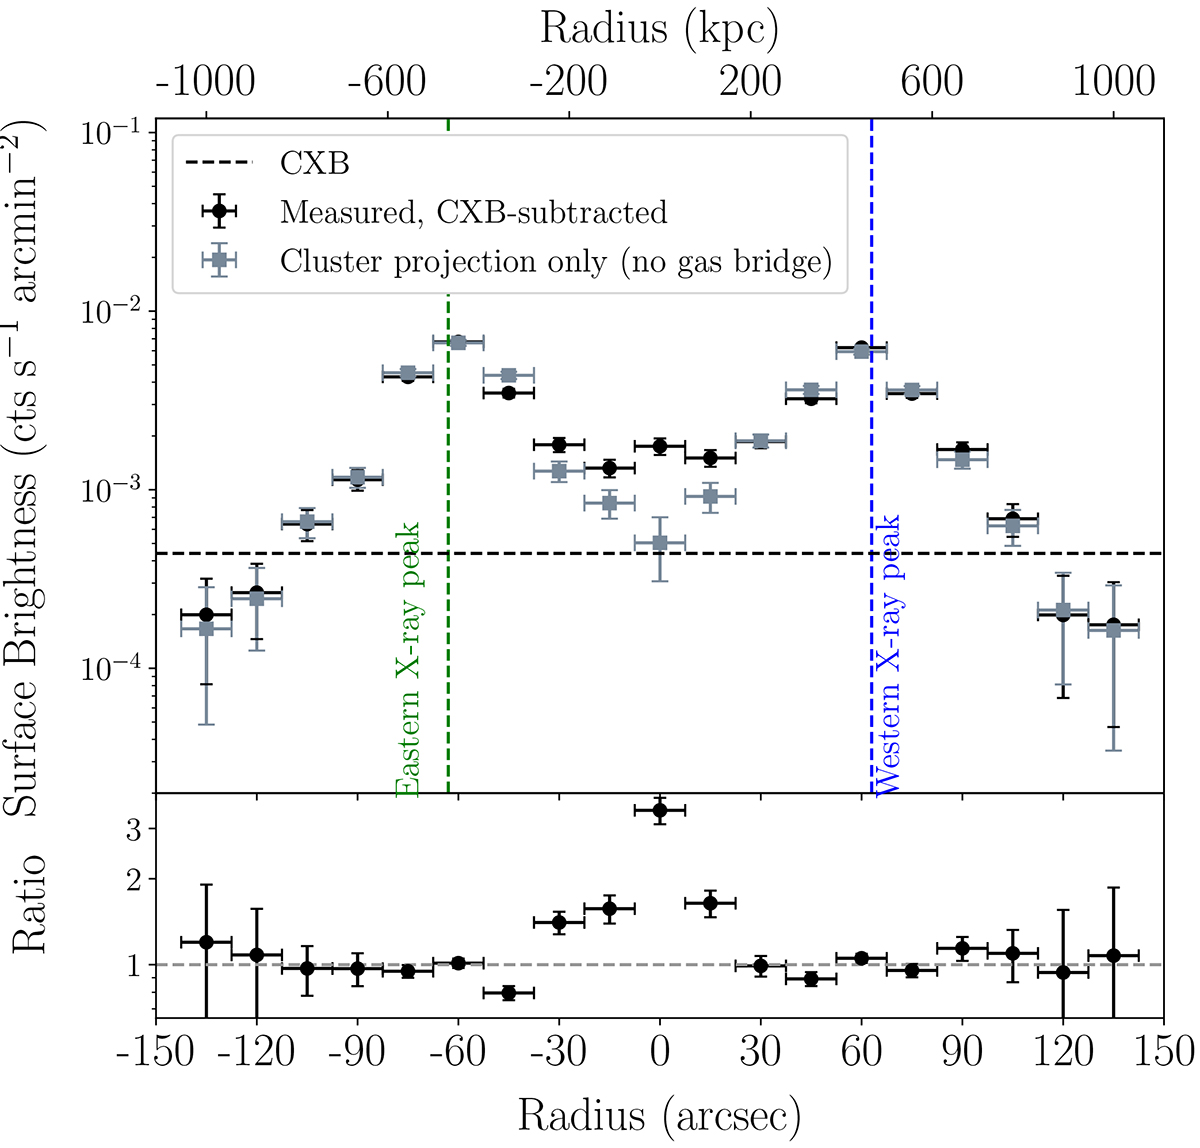
Fig. 8.
Download original image
Surface brightness profile (CXB-subtracted) across the merging axis for the boxes shown in Fig. 7, measured in the 0.5 − 2 keV band. The black points represent the measured SB values. The gray ones represent the expected SB values from cluster projection effects and assuming no excess gas bridge. The position of the eastern and western X-ray peaks are displayed by the dashed green and blue vertical lines respectively. The horizontal black dashed line shows the CXB level. The SB ratio between the measured values and the expected values if there was no gas bridge is shown in the bottom panel.
Current usage metrics show cumulative count of Article Views (full-text article views including HTML views, PDF and ePub downloads, according to the available data) and Abstracts Views on Vision4Press platform.
Data correspond to usage on the plateform after 2015. The current usage metrics is available 48-96 hours after online publication and is updated daily on week days.
Initial download of the metrics may take a while.