Fig. 5.
Download original image
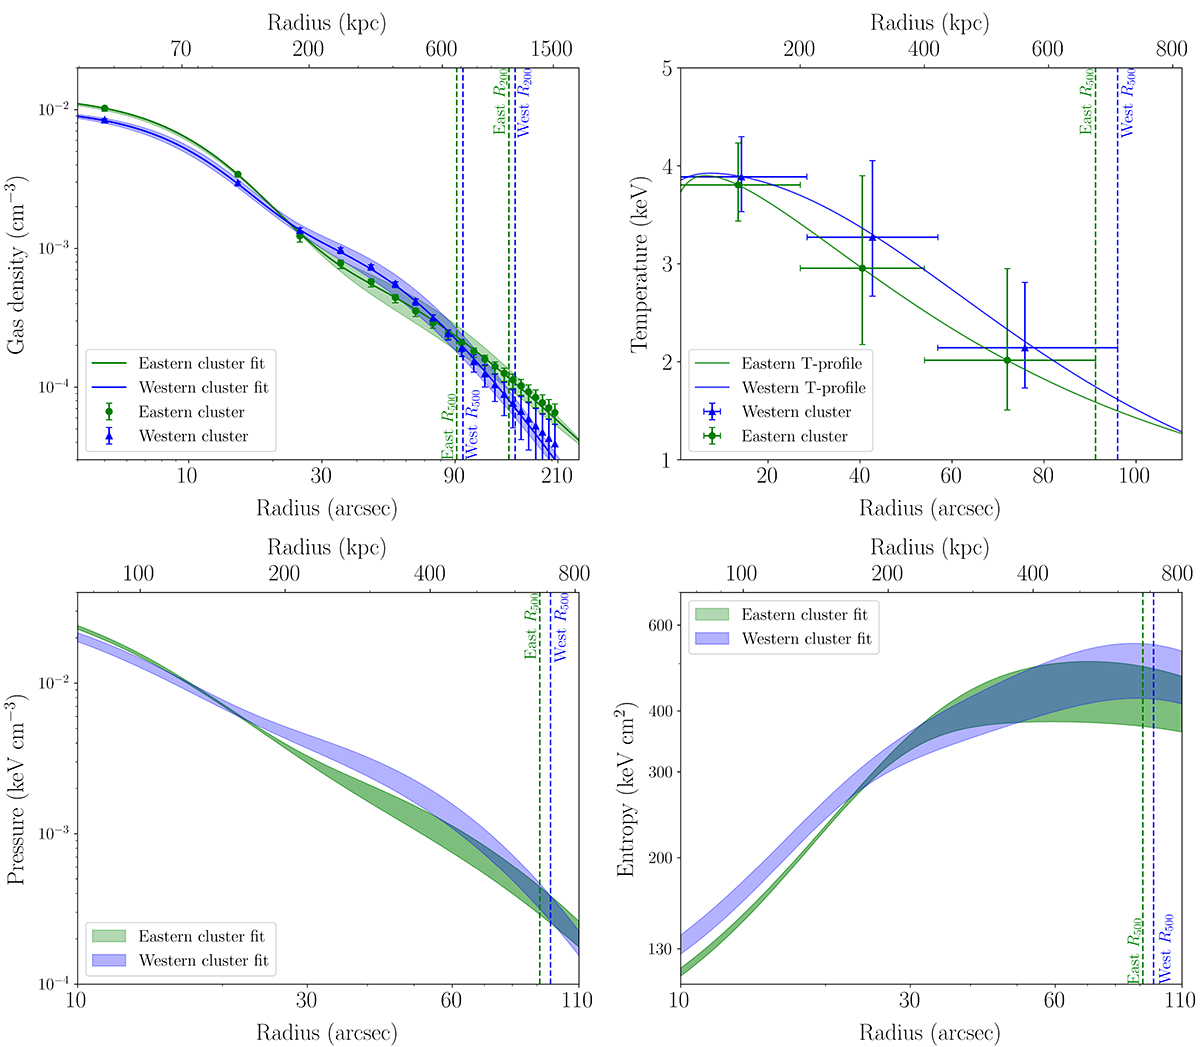
X-ray radial profiles for the eastern and western clusters (green and blue colors, respectively). The R500 values are displayed with the dashed vertical lines. Upper left: Gas (electron number) density ne profiles with their best-fit models. The R200 values are also displayed in this panel. Upper right: Temperature profiles (projected, 2D) with their best-fit deprojected, 3D models. Due to the limited data, no model uncertainties could be derived. Bottom left: Inferred pressure profile best-fit models computed as P = ne × TX, 3D. The 1σ error band is underestimated since it accounts only for the uncertainty of the ne profile assuming no uncertainty of the TX, 3D profile. Bottom right: Inferred entropy profile best-fit models computed as ![]() . The 1σ error band is underestimated since it accounts only for the uncertainty of the ne profile assuming no uncertainty of the TX, 3D profile.
. The 1σ error band is underestimated since it accounts only for the uncertainty of the ne profile assuming no uncertainty of the TX, 3D profile.
Current usage metrics show cumulative count of Article Views (full-text article views including HTML views, PDF and ePub downloads, according to the available data) and Abstracts Views on Vision4Press platform.
Data correspond to usage on the plateform after 2015. The current usage metrics is available 48-96 hours after online publication and is updated daily on week days.
Initial download of the metrics may take a while.