Fig. 4.
Download original image
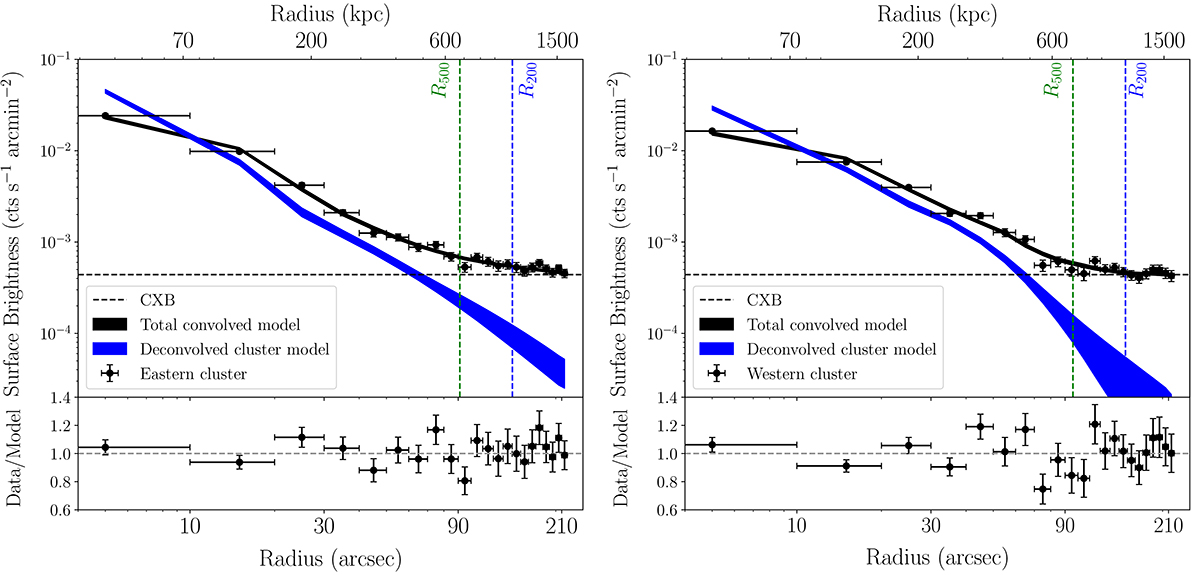
Surface brightness profiles (PIB-subtracted) for the eastern and western clusters (left and right panels, respectively) in the 0.5 − 2 keV band. The total (cluster+CXB) PSF-convolved profiles are displayed in black, while the cluster-only PSF-deconvolved profiles are shown in the filled blue band, which represents the 68.3% error band. The R500 and R200 values are displayed with the dashed green and blue vertical lines respectively. The CXB level is displayed with the black horizontal line.
Current usage metrics show cumulative count of Article Views (full-text article views including HTML views, PDF and ePub downloads, according to the available data) and Abstracts Views on Vision4Press platform.
Data correspond to usage on the plateform after 2015. The current usage metrics is available 48-96 hours after online publication and is updated daily on week days.
Initial download of the metrics may take a while.