Fig. 3.
Download original image
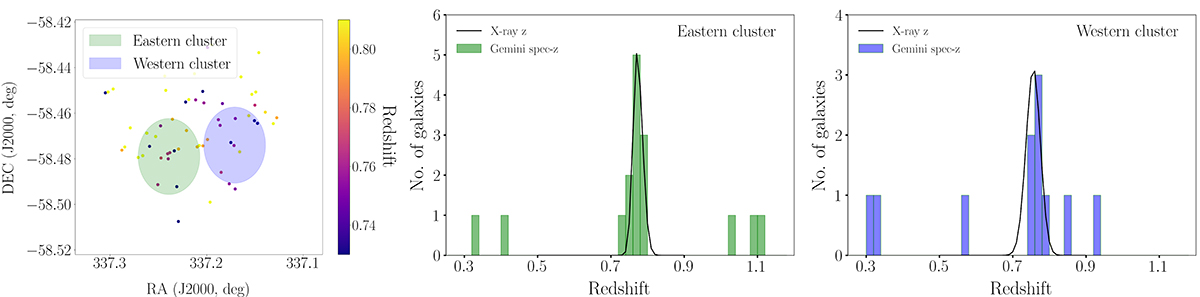
Spectroscopic redshift information of the two clusters. Left: Spatial distribution of the Gemini-studied galaxies with spectroscopic z. The color bar represents the z value of each galaxy. The light green and purple circles represent the 1′ area around the eastern and western clusters (X-ray peaks), respectively, and display the regions within which galaxies are assumed to belong to the respective cluster. Galaxies with bright yellow or deep blue colors do not belong to the cluster system. Middle: Spectroscopic galaxy z histogram for the eastern cluster. The black line represents the X-ray z normalized likelihood. Right: Same as in middle panel but for the western cluster.
Current usage metrics show cumulative count of Article Views (full-text article views including HTML views, PDF and ePub downloads, according to the available data) and Abstracts Views on Vision4Press platform.
Data correspond to usage on the plateform after 2015. The current usage metrics is available 48-96 hours after online publication and is updated daily on week days.
Initial download of the metrics may take a while.