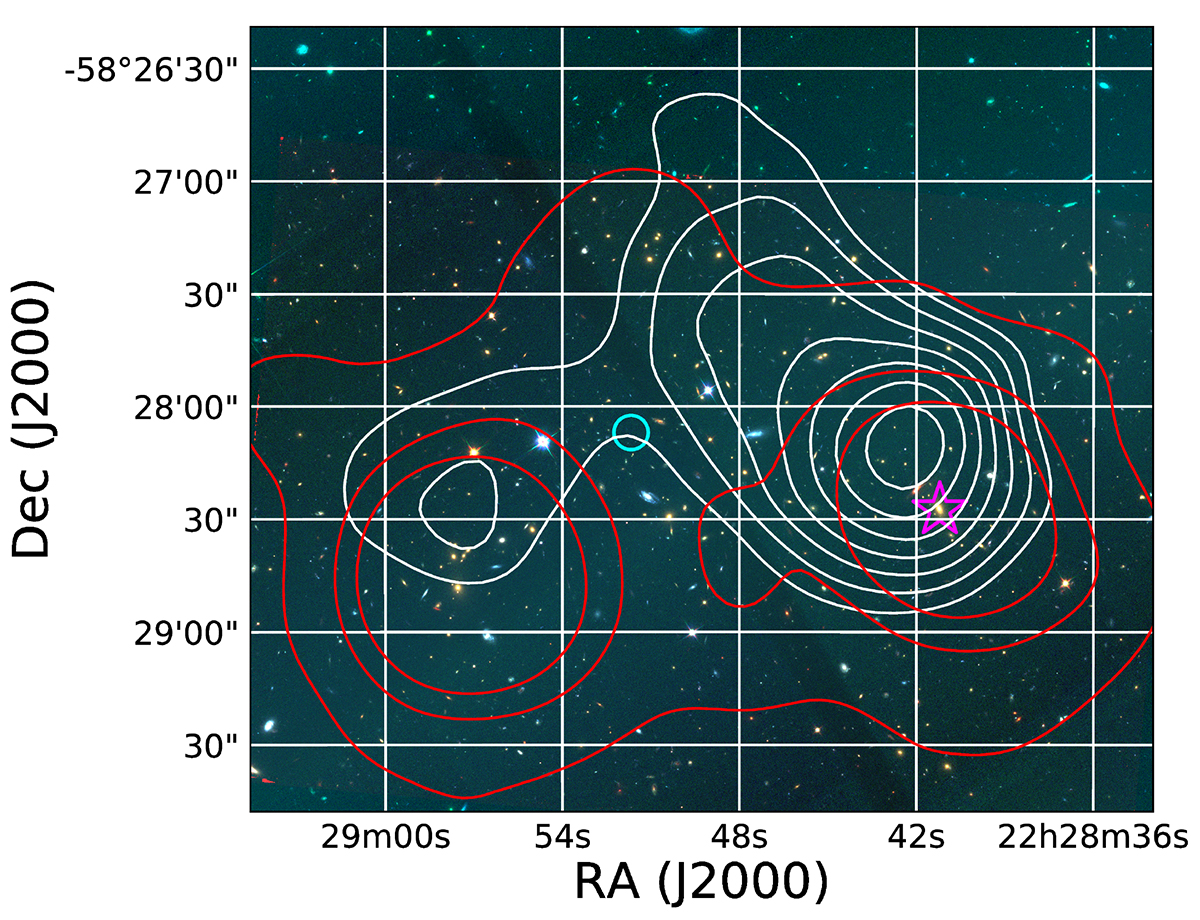
Fig. 2.
Download original image
Overlay of the signal-to-noise ratio map of the WL mass reconstruction (shown as white contours starting at level S/N = 1.5 in steps of ΔS/N = 0.5) and a color image of the inner cluster regions, employing the HST F140W, F814W, and F606W images for the R, G, B channels. For the non-parametric mass reconstruction shown in this image, the positions of the WL centers were left free to vary. In contrast, for the mass constraints presented in Sect. 3.2.4 we fix them to the X-ray cluster centers. The two positions, as well as the BCG positions, agree well within ≲1σ. The cyan circle indicates the SZ centre from Bleem et al. (2015), while the magenta star marks the BCG of the western cluster component. The red contours show the smoothed X-ray MOS count-rate in steps of 1.385 × 10⁻⁵ cts.
Current usage metrics show cumulative count of Article Views (full-text article views including HTML views, PDF and ePub downloads, according to the available data) and Abstracts Views on Vision4Press platform.
Data correspond to usage on the plateform after 2015. The current usage metrics is available 48-96 hours after online publication and is updated daily on week days.
Initial download of the metrics may take a while.