Fig. 7
Download original image
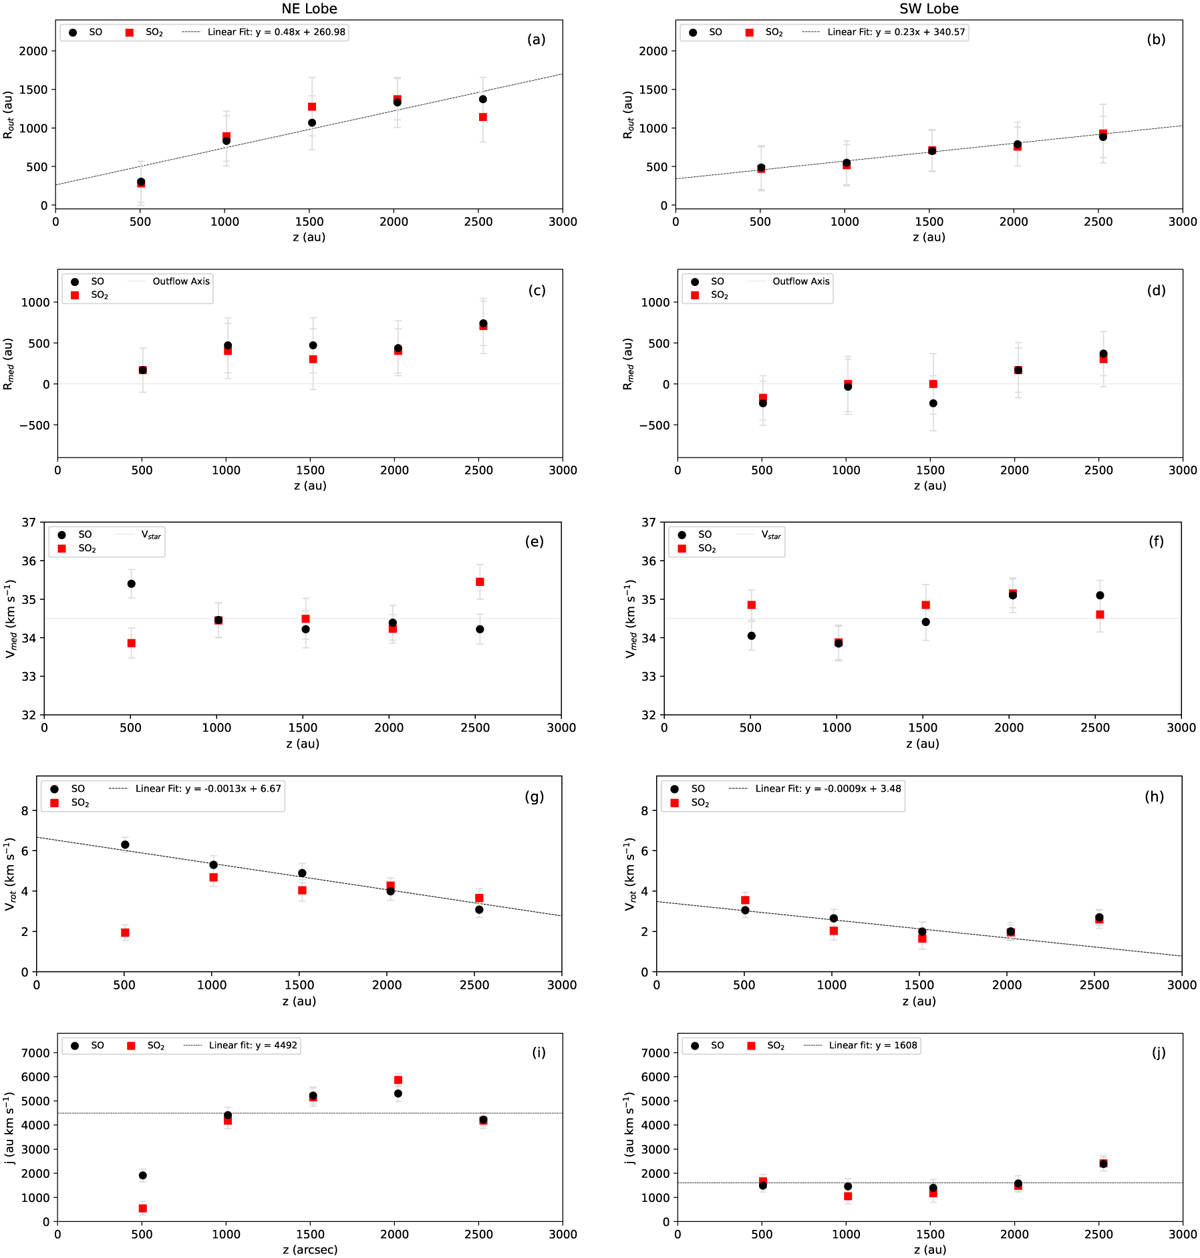
Outflow parameters derived from the PV diagrams for the cuts with steps of 0.″15 (~500 au) through the NE (left) and SW (right) lobes of the SO- and SO2-traced outflow. The markers represent the values obtained using the detected emission peaks in the PV diagrams (see Figs. A.1–A.4). Linear fits to the data are indicated with dashed lines (see the legend).
Current usage metrics show cumulative count of Article Views (full-text article views including HTML views, PDF and ePub downloads, according to the available data) and Abstracts Views on Vision4Press platform.
Data correspond to usage on the plateform after 2015. The current usage metrics is available 48-96 hours after online publication and is updated daily on week days.
Initial download of the metrics may take a while.