Fig. 6
Download original image
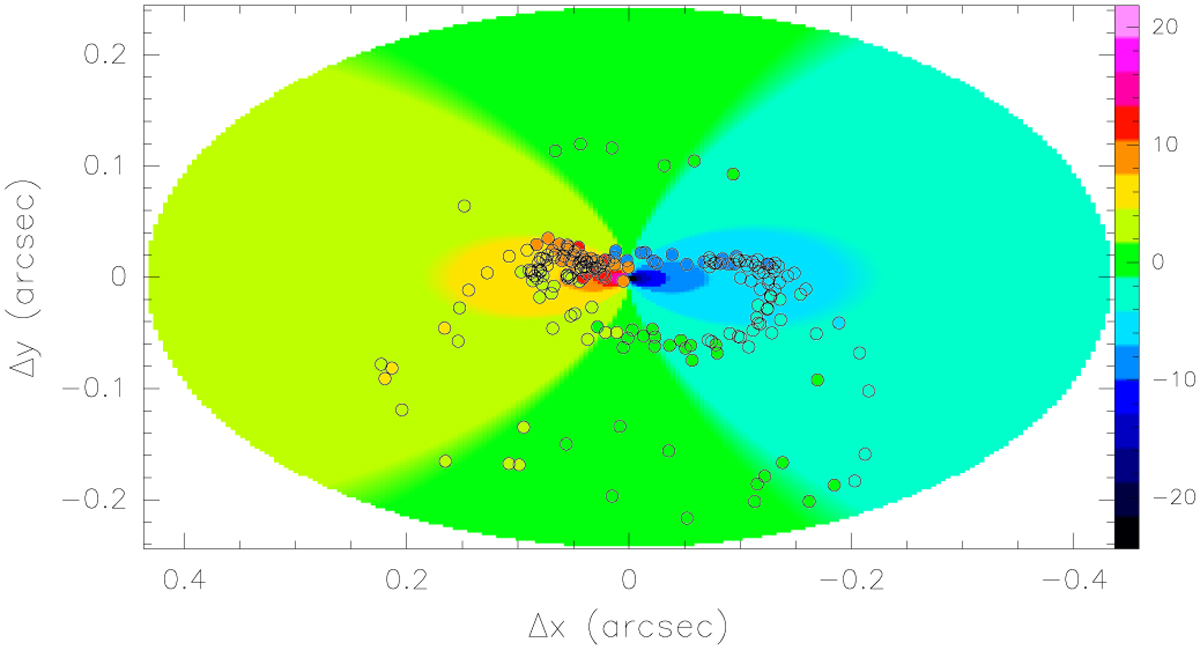
Planar Keplerian fit (considering all velocity features) of the CH3CN and CH3OH molecular data. The modelled velocity field is indicated by colour (the colour match of the spot with the corresponding sector of the velocity field indicates a correct approximation). The map is rotated by 50° clockwise with respect to that in Fig. 4.
Current usage metrics show cumulative count of Article Views (full-text article views including HTML views, PDF and ePub downloads, according to the available data) and Abstracts Views on Vision4Press platform.
Data correspond to usage on the plateform after 2015. The current usage metrics is available 48-96 hours after online publication and is updated daily on week days.
Initial download of the metrics may take a while.