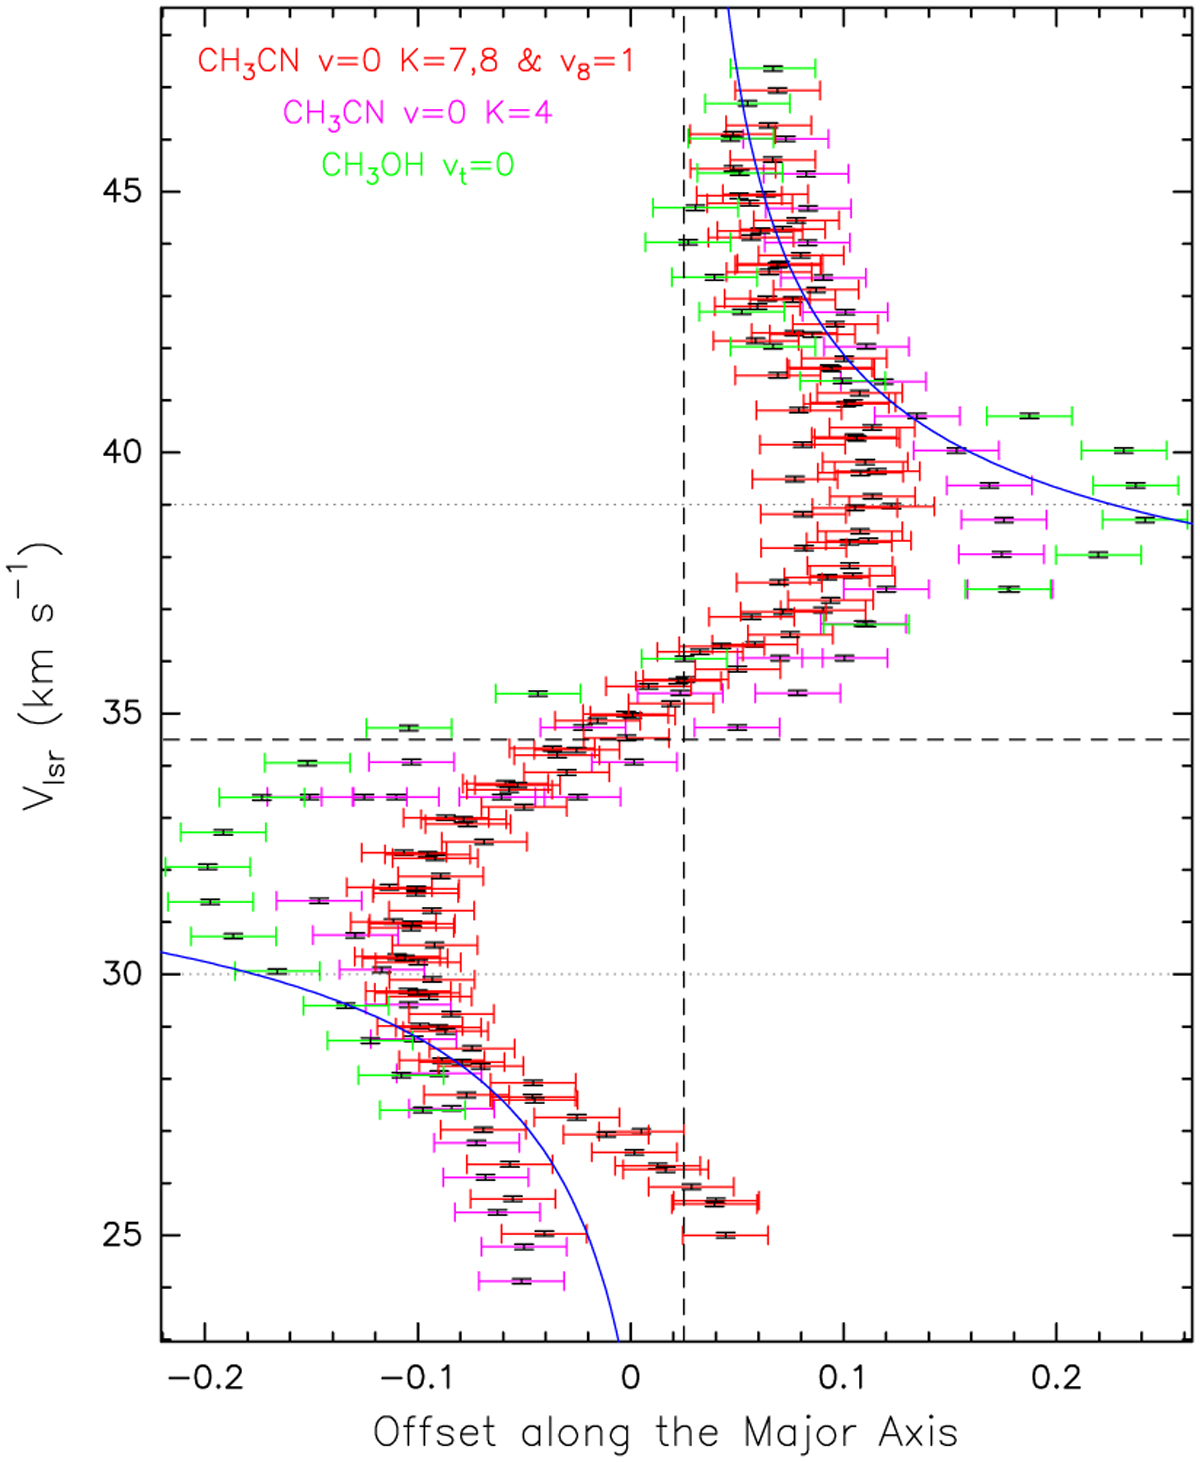
Fig. 5
Download original image
Linear Keplerian model. Red, magenta, and green error bars give major-axis-projected positions and VLsR for the high-velocity peaks (the velocity cuts are indicated by horizontal dotted lines) of the CH3CN and CH3OH molecular data (see the legend). Dashed black lines indicate the position of the central source and its VLsR. The blue curves represent a Keplerian fit for the central mass of 15 M⊙.
Current usage metrics show cumulative count of Article Views (full-text article views including HTML views, PDF and ePub downloads, according to the available data) and Abstracts Views on Vision4Press platform.
Data correspond to usage on the plateform after 2015. The current usage metrics is available 48-96 hours after online publication and is updated daily on week days.
Initial download of the metrics may take a while.