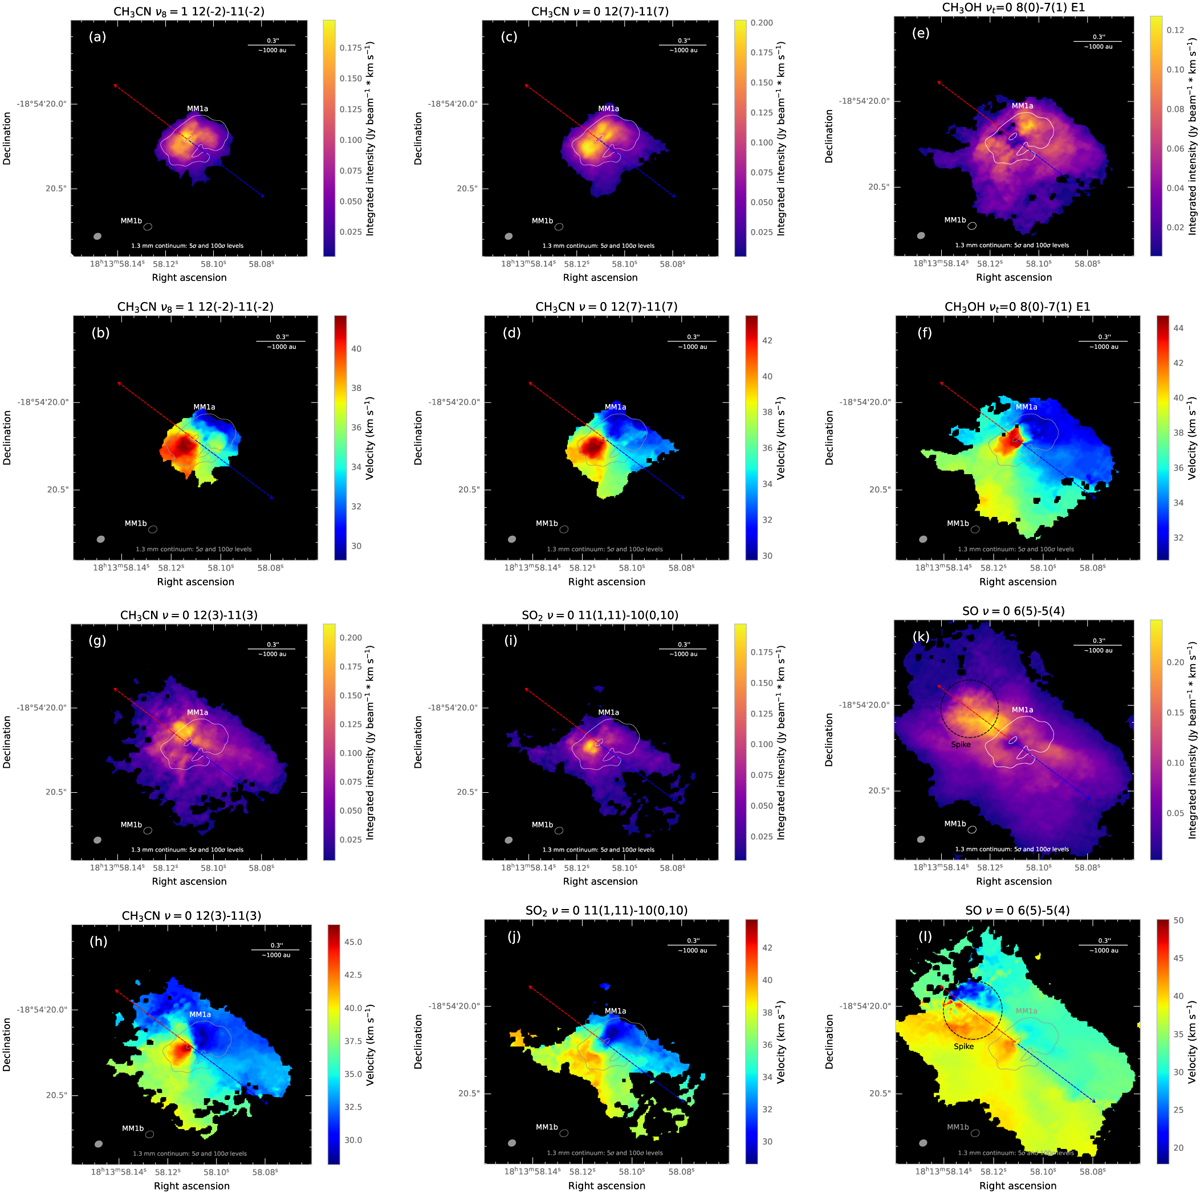
Fig. 2
Download original image
Moment 0 and 1 maps for the selected molecular line emissions detected at different scales. The synthesised beam of the molecular line data is indicated as a grey ellipse in the lower-left corner. The detected 1.3 mm continuum emission is indicated by white and grey contours (the levels are indicated at the bottom of each panel). The blue and red arrows indicate the orientation of the large-scale 12CO outflow presented in Ilee et al. (2016). The dotted black circle in the SO maps (panels k and l) indicates the velocity spike.
Current usage metrics show cumulative count of Article Views (full-text article views including HTML views, PDF and ePub downloads, according to the available data) and Abstracts Views on Vision4Press platform.
Data correspond to usage on the plateform after 2015. The current usage metrics is available 48-96 hours after online publication and is updated daily on week days.
Initial download of the metrics may take a while.