Fig. A.1
Download original image
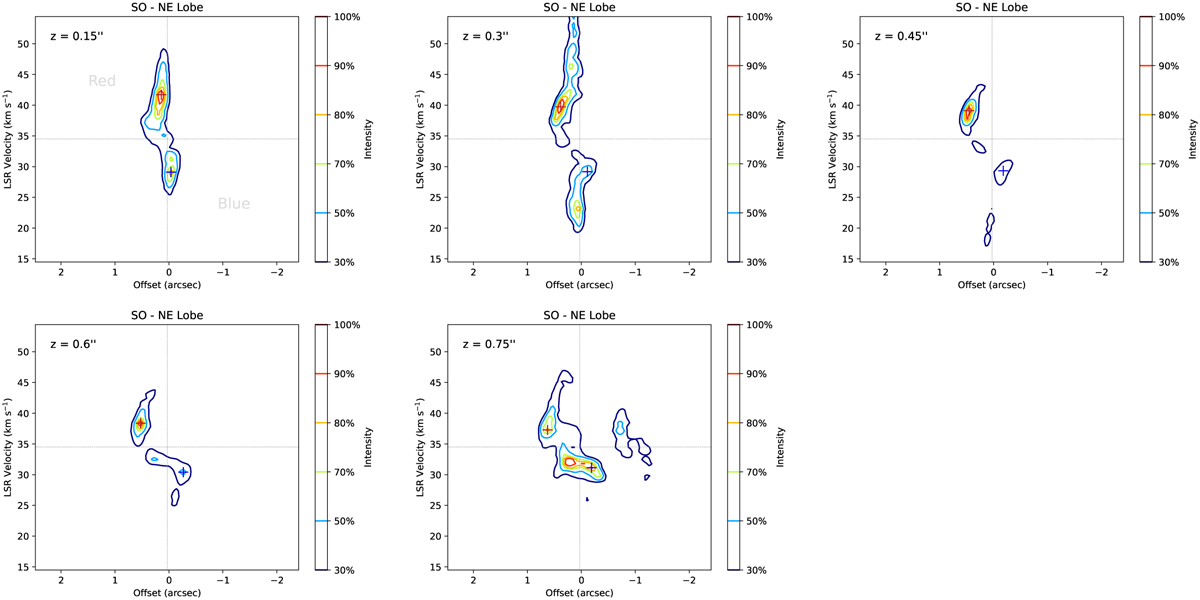
PV diagrams for the cuts with steps of 0.″15 through the NE lobe of the SO-traced outflow. The offset of the cut is indicated in the top-left corner of each panel. The red (blue) cross indicates the peak in the red (blue) part of each diagram. The vertical and horizontal lines mark, respectively, the position of the protostar and the systemic velocity, Vstar, obtained from the Keplerian fit (see Table 3). The zero offset corresponds to the fitted position of the 1.3 mm continuum peak.
Current usage metrics show cumulative count of Article Views (full-text article views including HTML views, PDF and ePub downloads, according to the available data) and Abstracts Views on Vision4Press platform.
Data correspond to usage on the plateform after 2015. The current usage metrics is available 48-96 hours after online publication and is updated daily on week days.
Initial download of the metrics may take a while.