Open Access
Fig. 1
Download original image
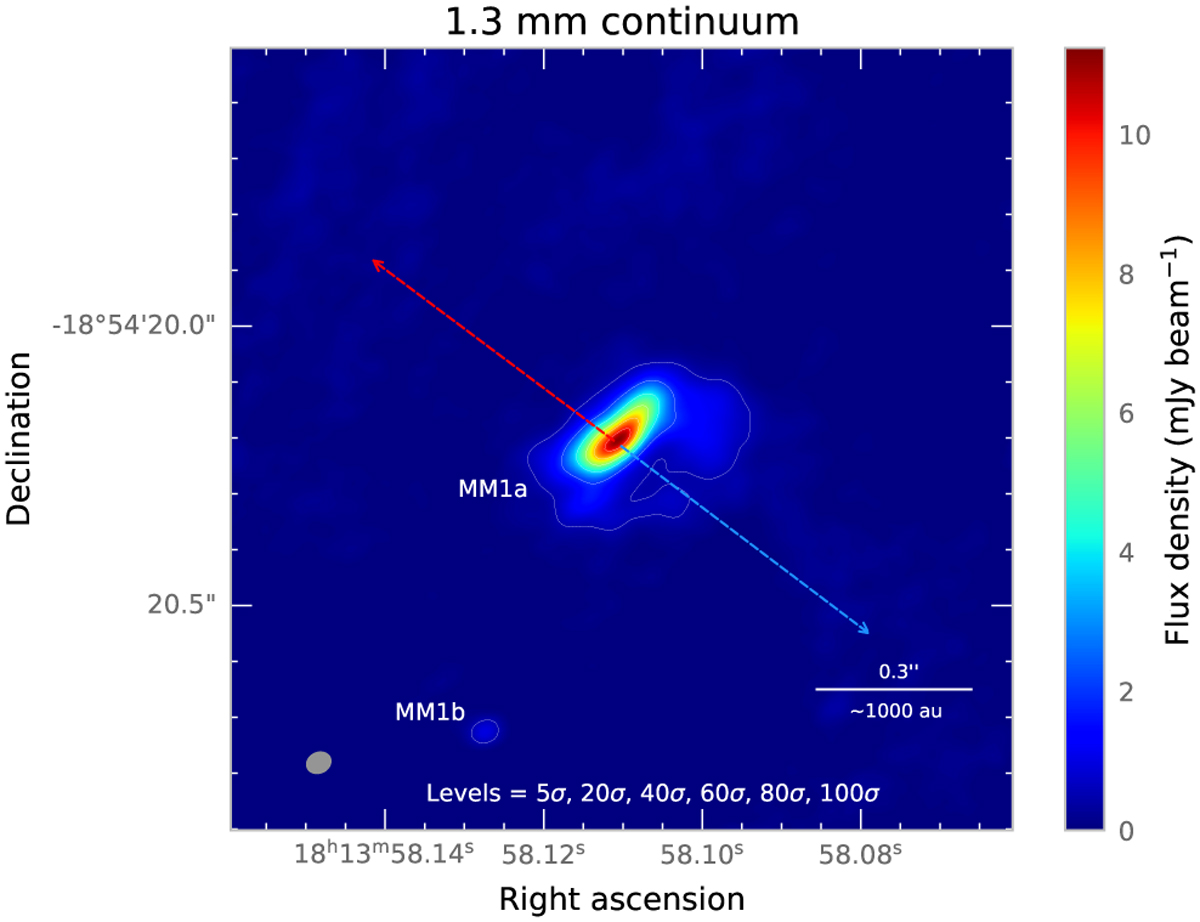
ALMA 1.3 mm continuum image of MM1a and MM1b. The contour levels are indicated at the bottom of the image with 1σ=~0.1 mJy beam−1 (Table 1). The synthesised beam is indicated as a grey ellipse in the lower-left corner. The blue and red arrows indicate the orientation of the large-scale 12CO outflow from Ilee et al. (2016).
Current usage metrics show cumulative count of Article Views (full-text article views including HTML views, PDF and ePub downloads, according to the available data) and Abstracts Views on Vision4Press platform.
Data correspond to usage on the plateform after 2015. The current usage metrics is available 48-96 hours after online publication and is updated daily on week days.
Initial download of the metrics may take a while.