Fig. 9
Download original image
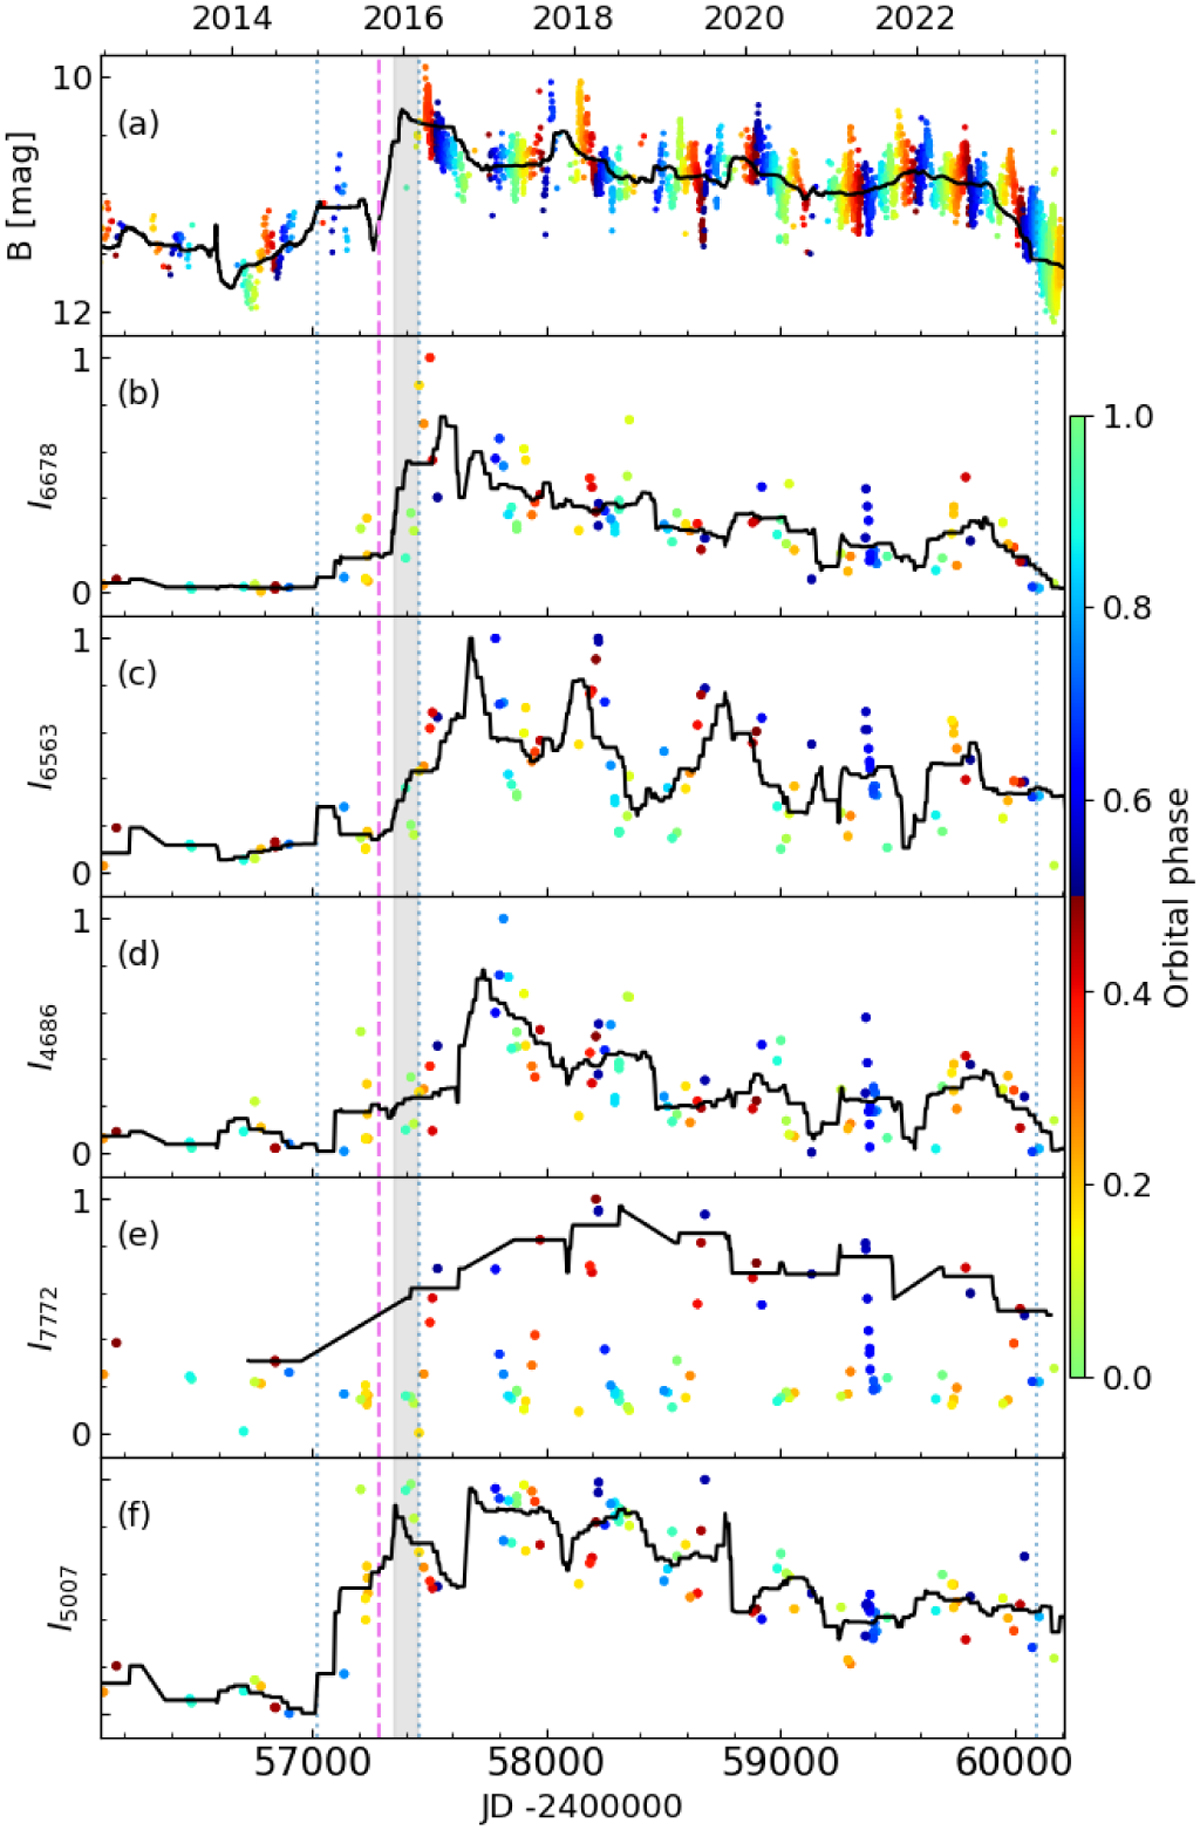
Relative intensity, Iλ, of the emission peak as a function of time for selected spectral lines, λ, and colored according to their orbital phase. The Iλ values have been divided by their maximum value over the time series to set them on a [0,1] interval, see text. The upper panel displays the B-band photometry. For each panel, a 227-day rolling mean is drawn in black. The SAP’s start, maximum, and end (vertical dotted lines) are shown. For the pink and gray lines, see the text.
Current usage metrics show cumulative count of Article Views (full-text article views including HTML views, PDF and ePub downloads, according to the available data) and Abstracts Views on Vision4Press platform.
Data correspond to usage on the plateform after 2015. The current usage metrics is available 48-96 hours after online publication and is updated daily on week days.
Initial download of the metrics may take a while.