Open Access
Fig. 6
Download original image
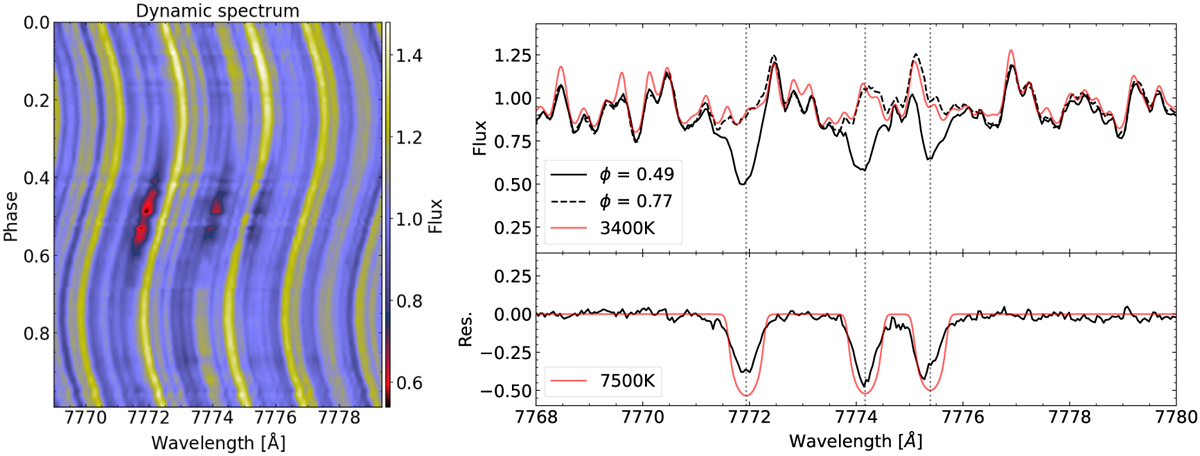
O I triplet lines. Left: dynamic spectrum. Right: T CrB spectra at phases 0.49 (black solid line) and 0.77 (dashed line), and a synthetic spectrum at 3400 K (red line). The bottom panel displays the difference spectrum between phases 0.49 and 0.77 (black line) and a synthetic spectrum at 7500 K.
Current usage metrics show cumulative count of Article Views (full-text article views including HTML views, PDF and ePub downloads, according to the available data) and Abstracts Views on Vision4Press platform.
Data correspond to usage on the plateform after 2015. The current usage metrics is available 48-96 hours after online publication and is updated daily on week days.
Initial download of the metrics may take a while.