Open Access
Fig. 5
Download original image
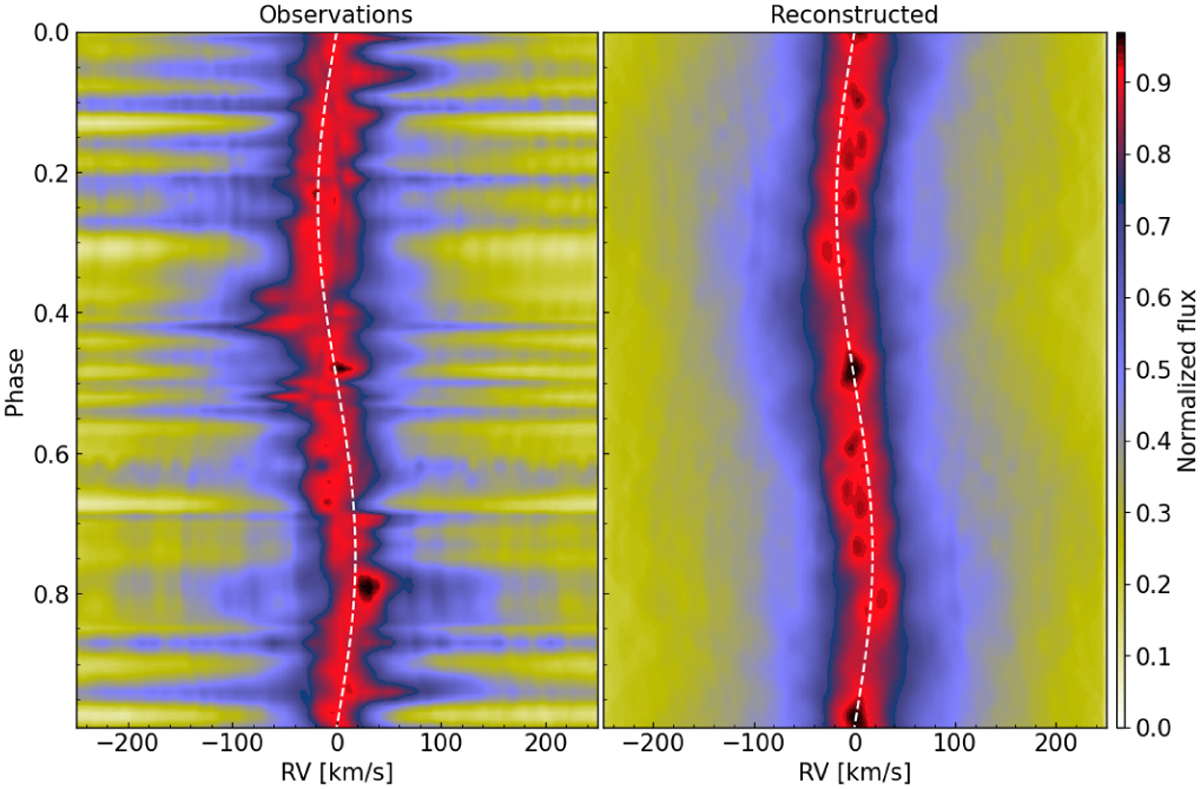
He II orbital variation. Left: observation after subtraction of the giant contribution and second normalization. Right: reconstructed dynamic spectrum. The motion of the white dwarf is shown with a white dashed line.
Current usage metrics show cumulative count of Article Views (full-text article views including HTML views, PDF and ePub downloads, according to the available data) and Abstracts Views on Vision4Press platform.
Data correspond to usage on the plateform after 2015. The current usage metrics is available 48-96 hours after online publication and is updated daily on week days.
Initial download of the metrics may take a while.