Fig. 4
Download original image
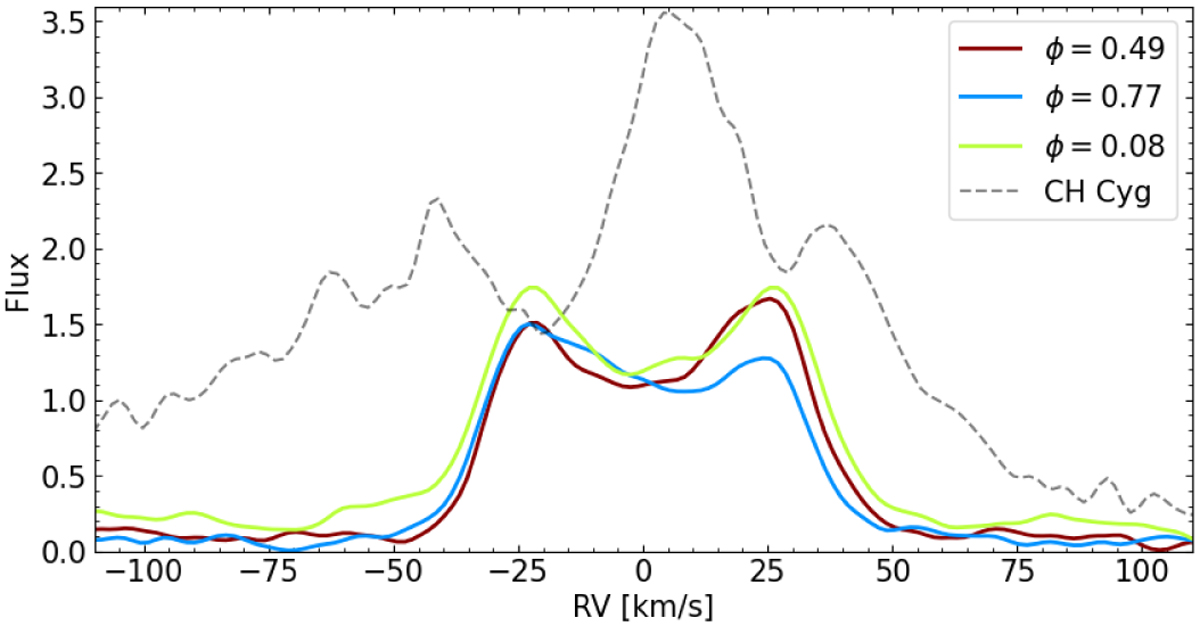
Spectral profiles of the [O III] line at 5007 Å at different orbital phases of the same cycle. The profiles are obtained after subtracting the giant contribution. The y-axis is the pseudo-continuum-normalized flux obtained as the median value of the spectral window. One spectrum of the symbiotic system CH Cyg is shown for comparison.
Current usage metrics show cumulative count of Article Views (full-text article views including HTML views, PDF and ePub downloads, according to the available data) and Abstracts Views on Vision4Press platform.
Data correspond to usage on the plateform after 2015. The current usage metrics is available 48-96 hours after online publication and is updated daily on week days.
Initial download of the metrics may take a while.