Fig. 10
Download original image
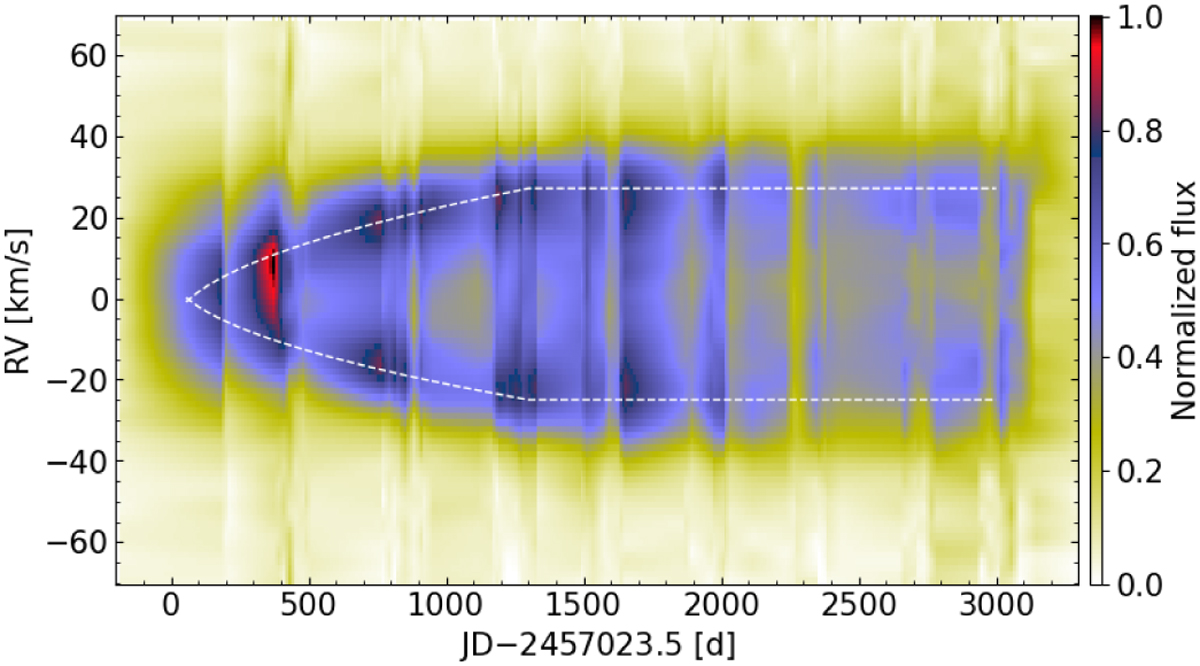
Temporal evolution of the [O III] profile. The SAP start is set at t = 0. The emission profiles are obtained after removing the giant contribution and interpolating between the observations. The evolution of the peak positions is represented by the dashed white line. The emergence and acceleration of the nebula is clearly seen.
Current usage metrics show cumulative count of Article Views (full-text article views including HTML views, PDF and ePub downloads, according to the available data) and Abstracts Views on Vision4Press platform.
Data correspond to usage on the plateform after 2015. The current usage metrics is available 48-96 hours after online publication and is updated daily on week days.
Initial download of the metrics may take a while.