Fig. 8
Download original image
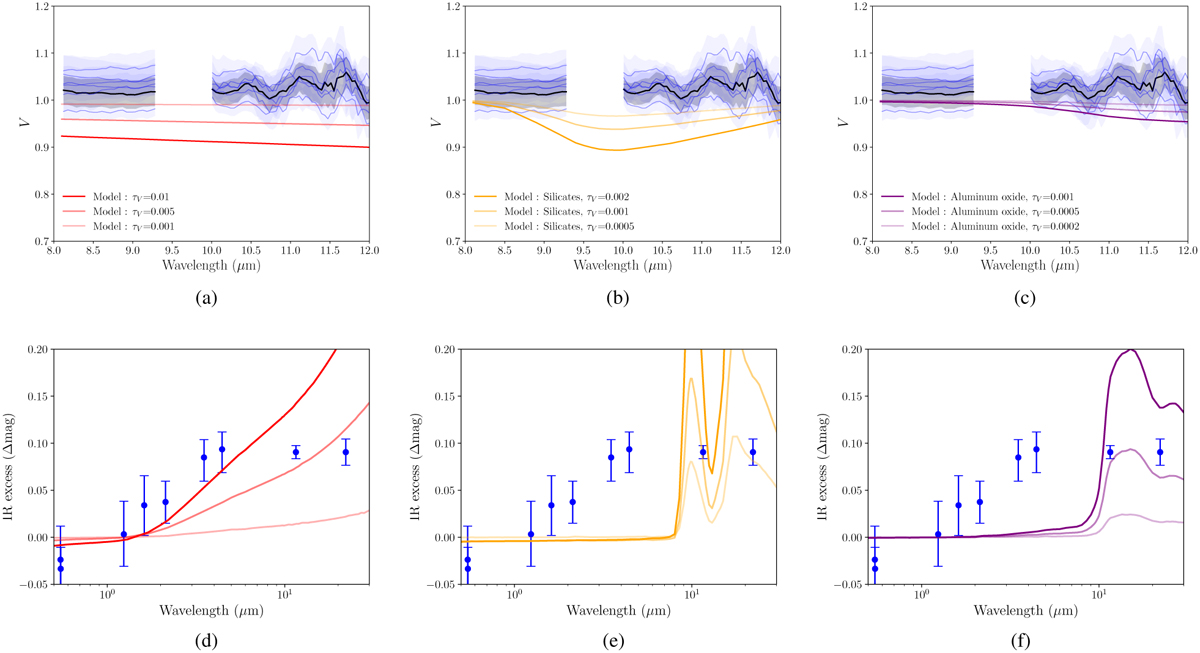
Visibility in the N band and IR excess from CSE models of dust computed with DUSTY for the Cepheid η Aql. From left to right, the three cases correspond to iron, silicates, and aluminum oxide, which are plotted in red, yellow, and purple, respectively. For each CSE model, we used a different optical depth, as indicated in the legend.
Current usage metrics show cumulative count of Article Views (full-text article views including HTML views, PDF and ePub downloads, according to the available data) and Abstracts Views on Vision4Press platform.
Data correspond to usage on the plateform after 2015. The current usage metrics is available 48-96 hours after online publication and is updated daily on week days.
Initial download of the metrics may take a while.