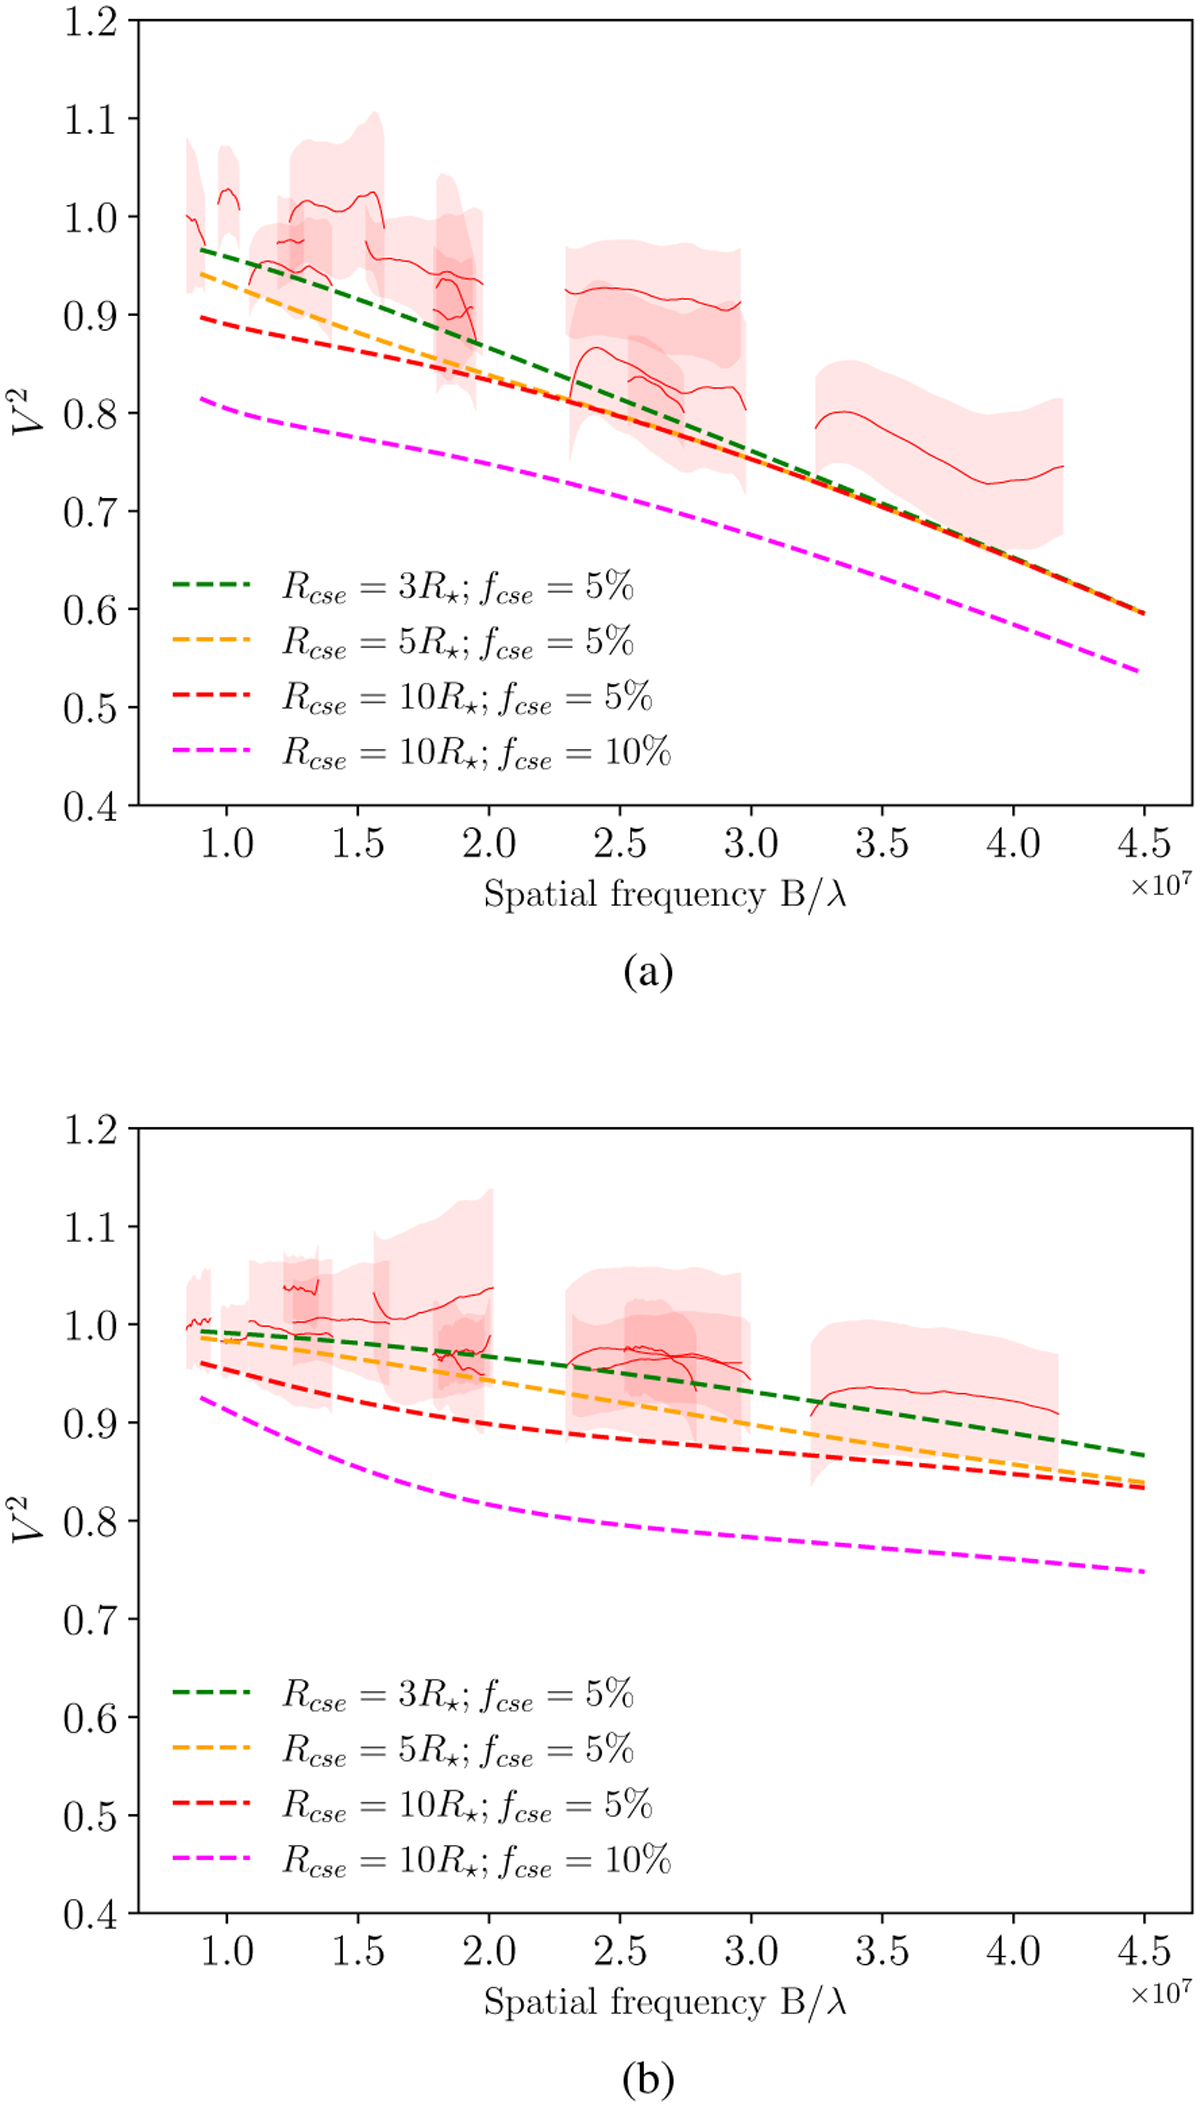
Fig. 6
Download original image
Examples of CSE models with a Gaussian brightness intensity distribution in the case of (a) β Dor (1.86 mas) and (b) U Car (0.80 mas). The examples illustrate the difficulty of resolving a compact CSE with MATISSE/VLTI. For a CSE flux contribution of 5% of the total flux, compact CSEs between 5 and 10 R⋆ cannot be resolved (see the green, orange, and red models). The large and bright model shown as the dashed magenta line is excluded in both stars, however. The upper limits for different CSE models are given in Table 5.
Current usage metrics show cumulative count of Article Views (full-text article views including HTML views, PDF and ePub downloads, according to the available data) and Abstracts Views on Vision4Press platform.
Data correspond to usage on the plateform after 2015. The current usage metrics is available 48-96 hours after online publication and is updated daily on week days.
Initial download of the metrics may take a while.