Fig. 5
Download original image
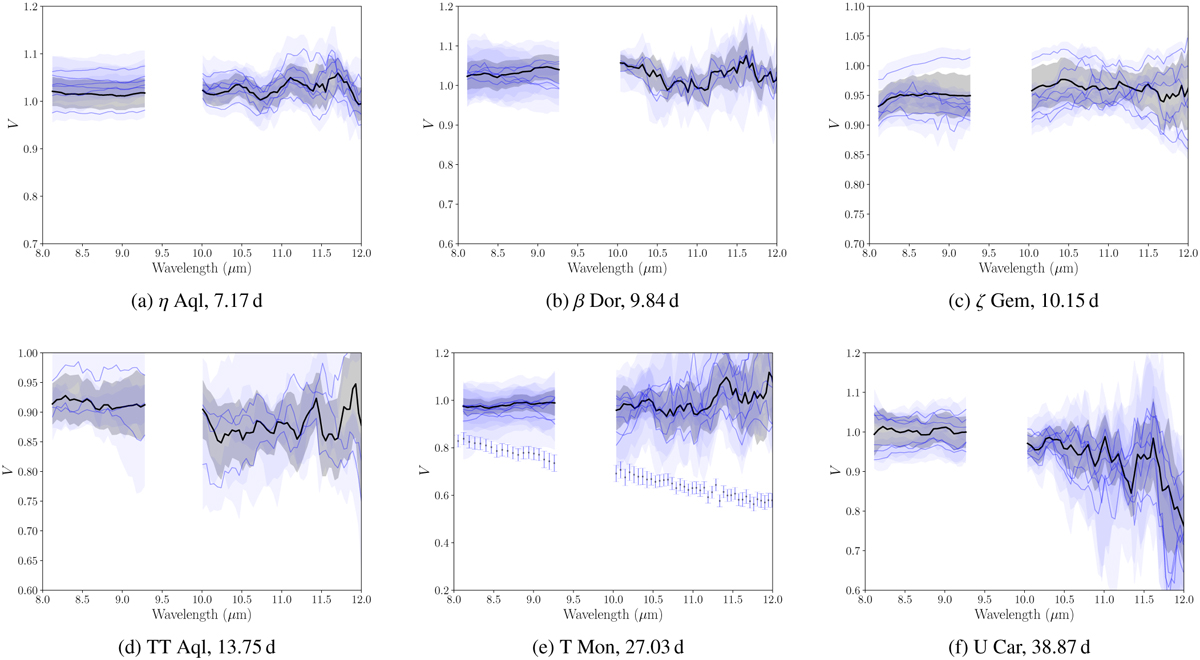
Visibility in the N band plotted against the wavelength. The black curve represents the weighted mean of the observations. U Aql is not presented since we only measured the correlated flux and the X Sgr photometry in the N band was not usable. The spectral band between 9.3 and 10 micron was removed because the atmosphere is not transmissive. In the case of T Mon, we overplot the weighted mean of MIDI/VLTI observation as given by Gallenne et al. (2013) for comparison.
Current usage metrics show cumulative count of Article Views (full-text article views including HTML views, PDF and ePub downloads, according to the available data) and Abstracts Views on Vision4Press platform.
Data correspond to usage on the plateform after 2015. The current usage metrics is available 48-96 hours after online publication and is updated daily on week days.
Initial download of the metrics may take a while.