Fig. 3
Download original image
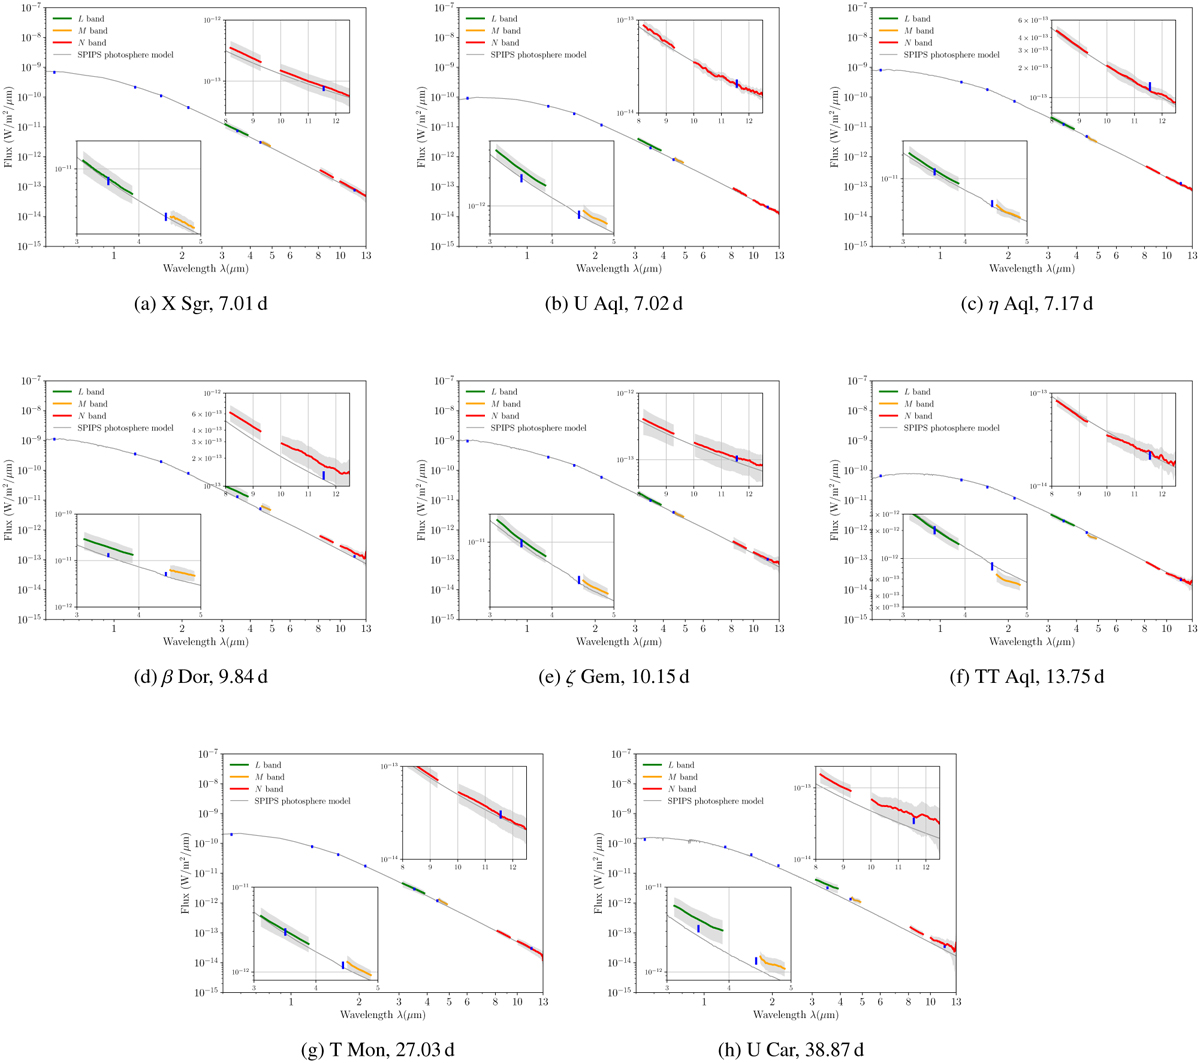
MATISSE calibrated flux in the L, M, and N bands together with the ATLAS9 atmospheric model interpolated for each star by SPIPS at the specific pulsation phase of observations. The blue bars represent the photometry interpolated at the phase of the MATISSE observations by SPIPS. In the case of U Aql, the N-band flux is the correlated flux. See Sect. 4 for details of the calibration.
Current usage metrics show cumulative count of Article Views (full-text article views including HTML views, PDF and ePub downloads, according to the available data) and Abstracts Views on Vision4Press platform.
Data correspond to usage on the plateform after 2015. The current usage metrics is available 48-96 hours after online publication and is updated daily on week days.
Initial download of the metrics may take a while.