Fig. 2
Download original image
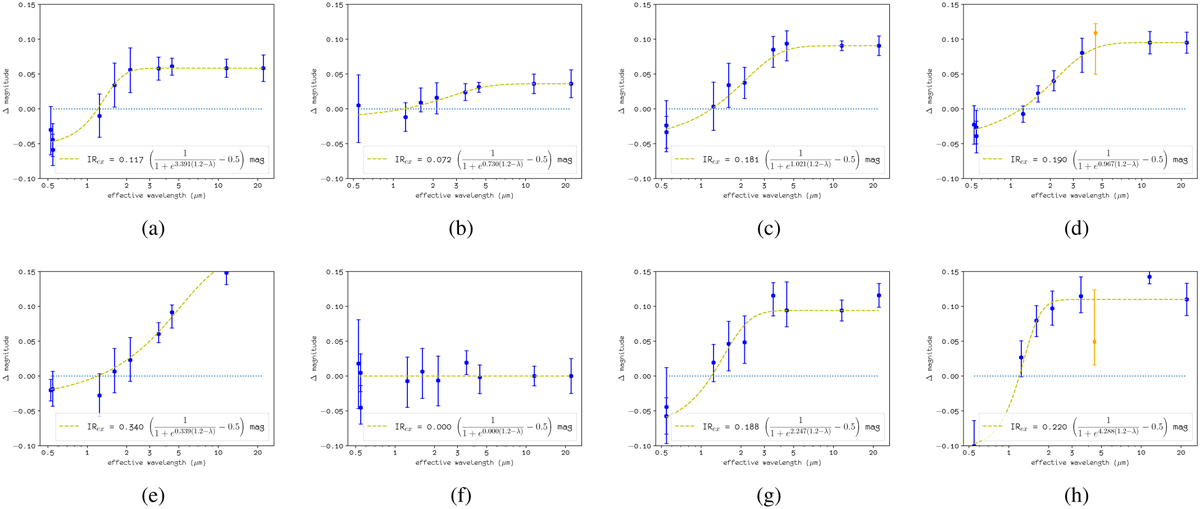
IR excess derived by SPIPS for each star of the sample (see also Table 2): X Sgr, 7.01 d (a), U Aql, 7.02 d (b), η Aql, 7.17 d (c), β Dor, 9.84 d (d), ζ Gem, 10.15 d (e), TT Aql, 13.75 d (f), T Mon, 27.03 d (g), and U Car, 38.87 d (h). The excess is presented as the magnitude difference between the atmospheric model and the median photometric data, where positive and negative values indicate emission and absorption, respectively. The fitted IR excess (dashed green line) is modeled with a logistic function presented at the bottom of each figure. The orange bar in panel (h) for U Car corresponds to the I2 Spitzer band, ignored in the fit due to CO band-head absorption at 4.6 micron (Marengo et al. 2010a; Scowcroft et al. 2016; Gallenne et al. 2021).
Current usage metrics show cumulative count of Article Views (full-text article views including HTML views, PDF and ePub downloads, according to the available data) and Abstracts Views on Vision4Press platform.
Data correspond to usage on the plateform after 2015. The current usage metrics is available 48-96 hours after online publication and is updated daily on week days.
Initial download of the metrics may take a while.