Fig. 1
Download original image
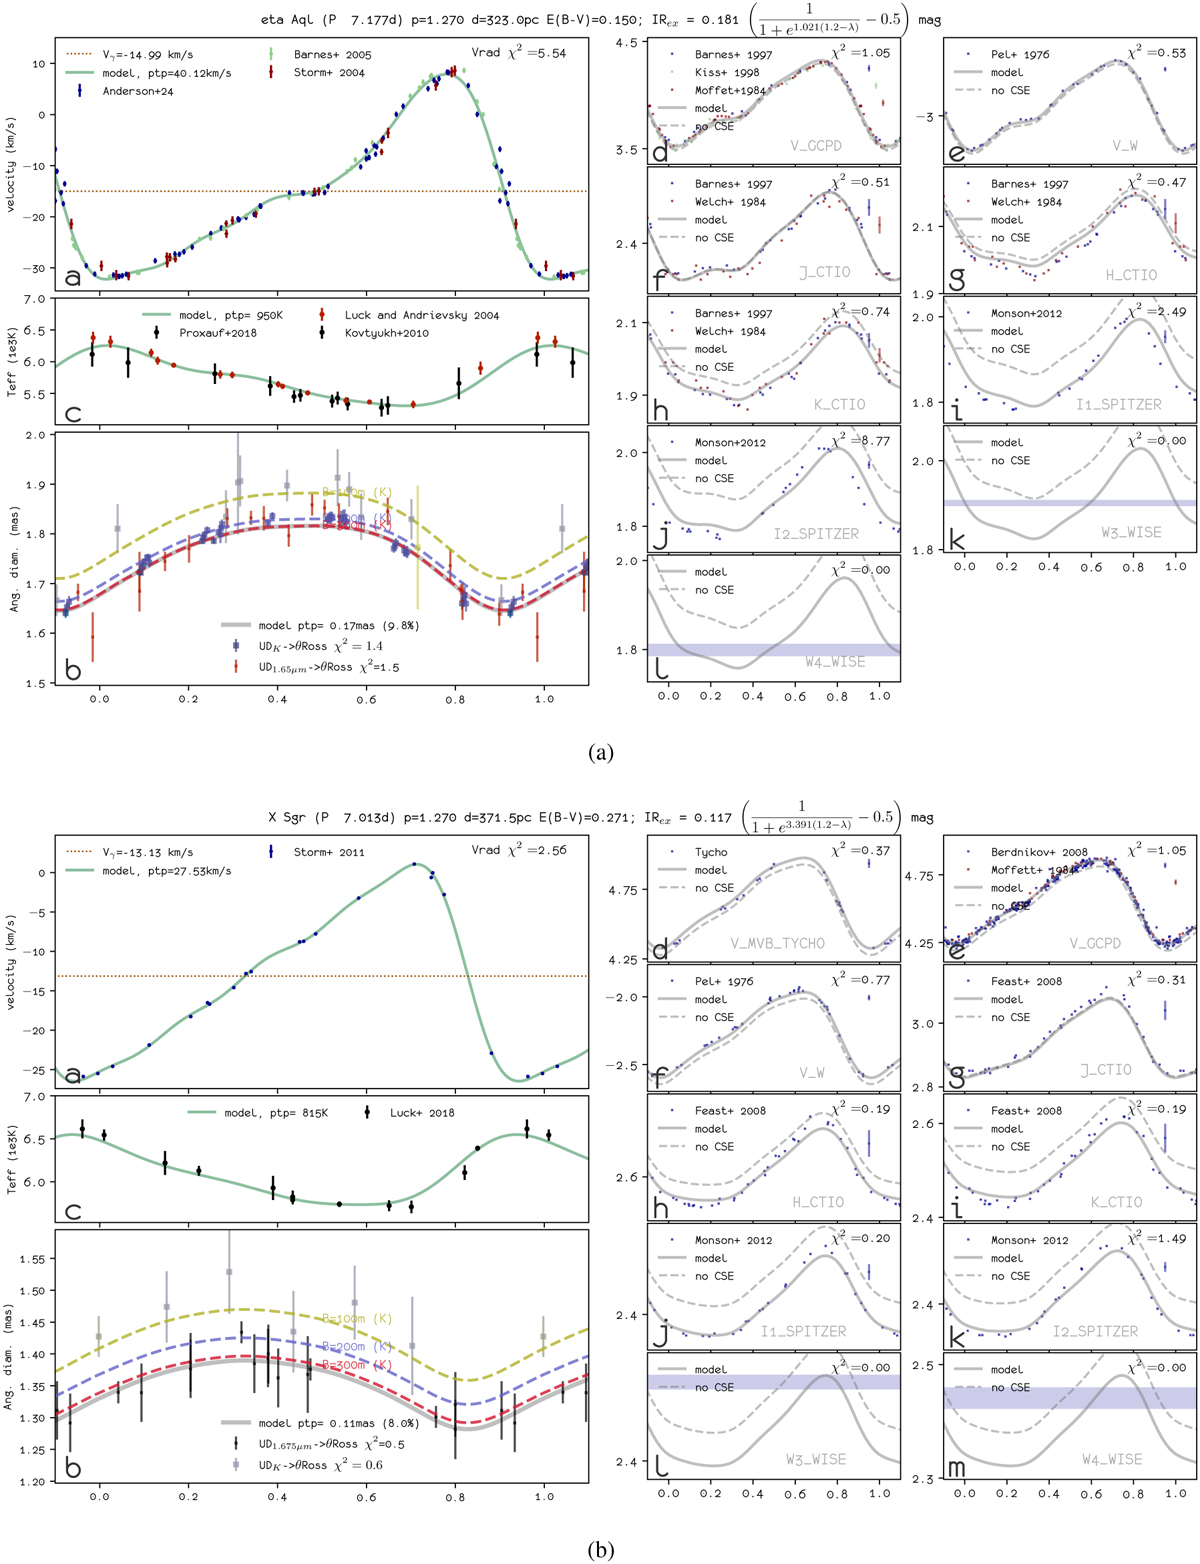
SPIPS results for η Aql (a) and X Sgr (b) as a function of the pulsation phase. Above the figures, the p factor is indicated, along with the fitted distance d, the fitted color excess E(B − V), and the parametric CSE model. The thick gray line corresponds to the best SPIPS model, which is composed of the latter model without CSE plus an IR excess model. In the angular diameter panels, the gray curve corresponds to limb-darkened (LD) angular diameters. We provide references for the observations in Table B.2.
Current usage metrics show cumulative count of Article Views (full-text article views including HTML views, PDF and ePub downloads, according to the available data) and Abstracts Views on Vision4Press platform.
Data correspond to usage on the plateform after 2015. The current usage metrics is available 48-96 hours after online publication and is updated daily on week days.
Initial download of the metrics may take a while.