Open Access
Fig. 5
Download original image
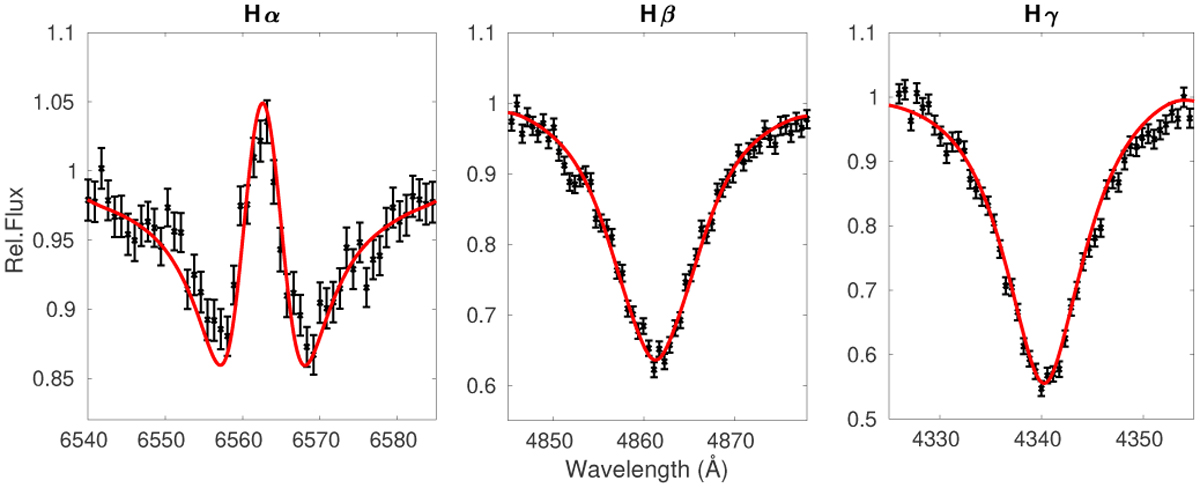
HDUST fit to LAMOST spectrum from 22 May, 2013. The observed spectrum is plotted in black with 1σ error bars, while the model spectrum for logρ0 = −12.5 [cgs], n=2.5 and convolved to the LAMOST resolution appears in red.
Current usage metrics show cumulative count of Article Views (full-text article views including HTML views, PDF and ePub downloads, according to the available data) and Abstracts Views on Vision4Press platform.
Data correspond to usage on the plateform after 2015. The current usage metrics is available 48-96 hours after online publication and is updated daily on week days.
Initial download of the metrics may take a while.