Open Access
Fig. 3
Download original image
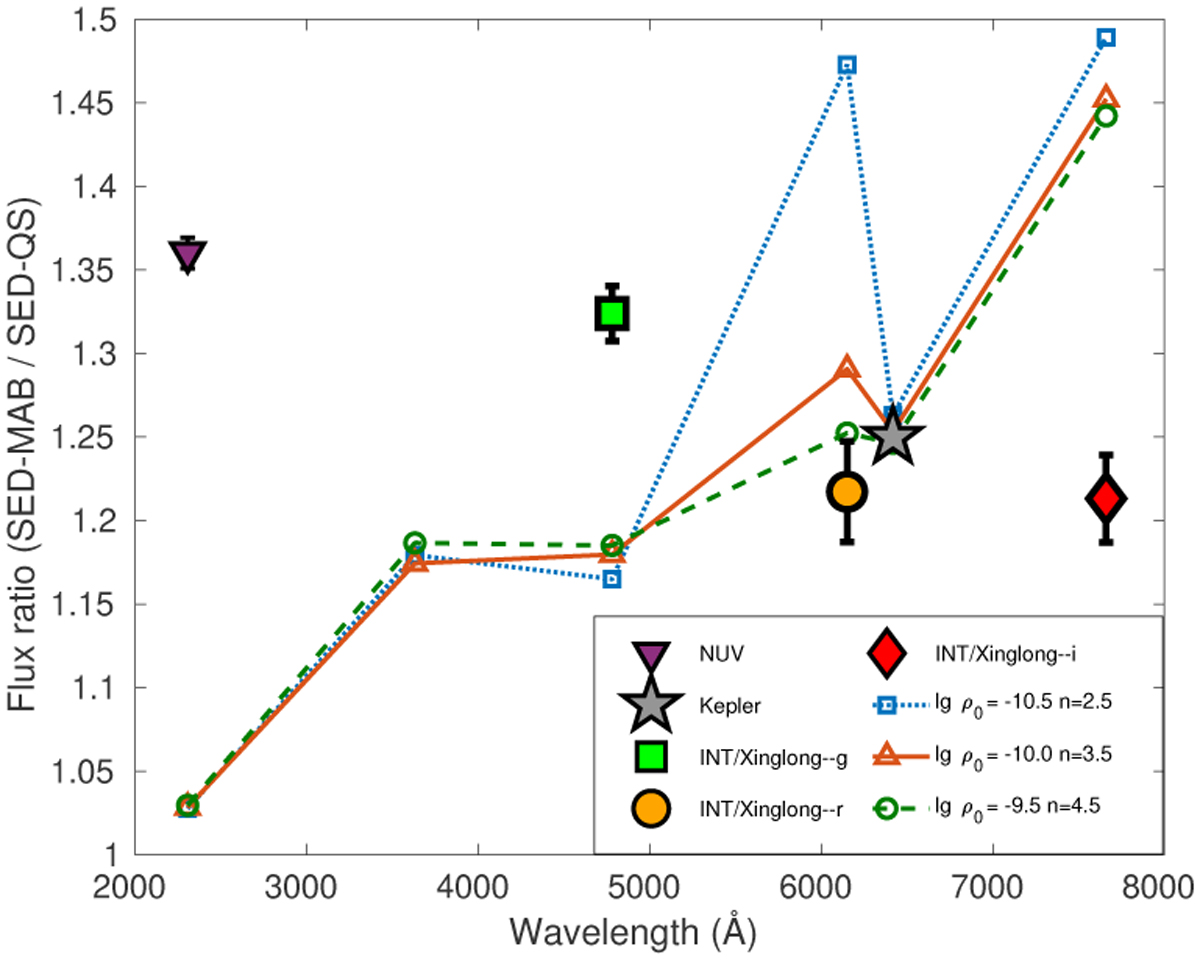
Triangle, square, circle, diamond, and asterisk mark the observed MAB/PP SED ratios in the NUV band; INT/Xinglong g, r and i bands; and the Kepler band, respectively. Dashed lines with different colors represent SED ratios predicted by HDUST models with various parameters (as labeled) during the MAB and PP phases.
Current usage metrics show cumulative count of Article Views (full-text article views including HTML views, PDF and ePub downloads, according to the available data) and Abstracts Views on Vision4Press platform.
Data correspond to usage on the plateform after 2015. The current usage metrics is available 48-96 hours after online publication and is updated daily on week days.
Initial download of the metrics may take a while.