Fig. 2
Download original image
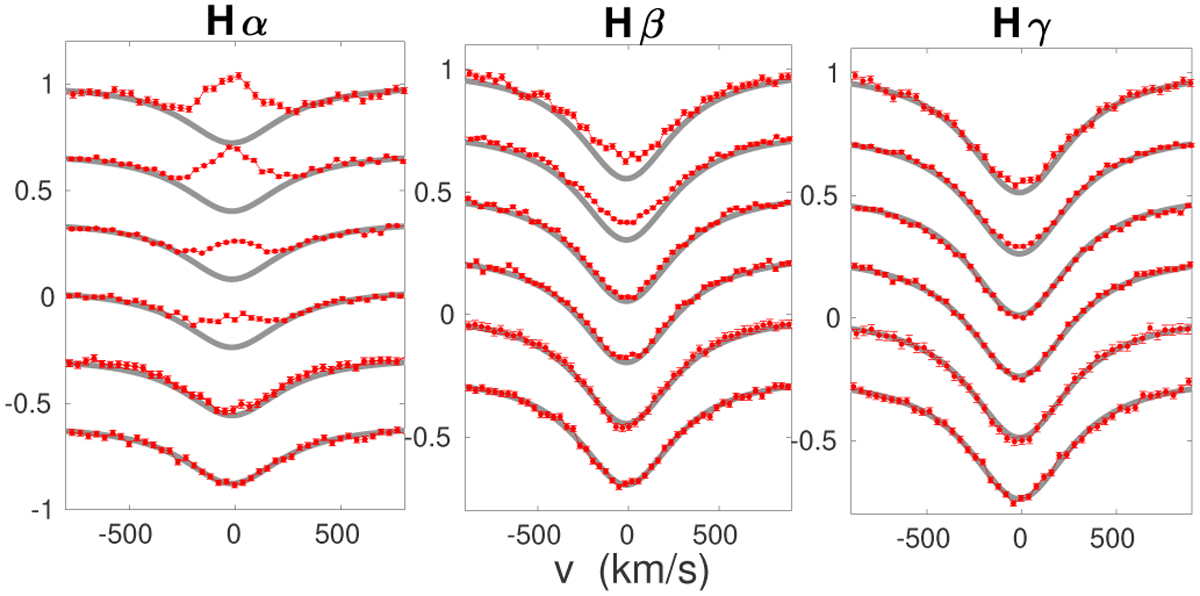
Continuum-normalized Hα, Hβ, and Hγ line profiles observed by LAMOST (red), compared to a Lorentz profile (gray) fit to the respective latest spectrum. All spectra are shifted to the rest frame of the respective latest observation. From top to bottom, the observing dates are 22 May 2013, 04 September 2013, 13 September 2014, 1 October 2015, 15 May 2017 and 14 June 2017, respectively.
Current usage metrics show cumulative count of Article Views (full-text article views including HTML views, PDF and ePub downloads, according to the available data) and Abstracts Views on Vision4Press platform.
Data correspond to usage on the plateform after 2015. The current usage metrics is available 48-96 hours after online publication and is updated daily on week days.
Initial download of the metrics may take a while.