Fig. 1
Download original image
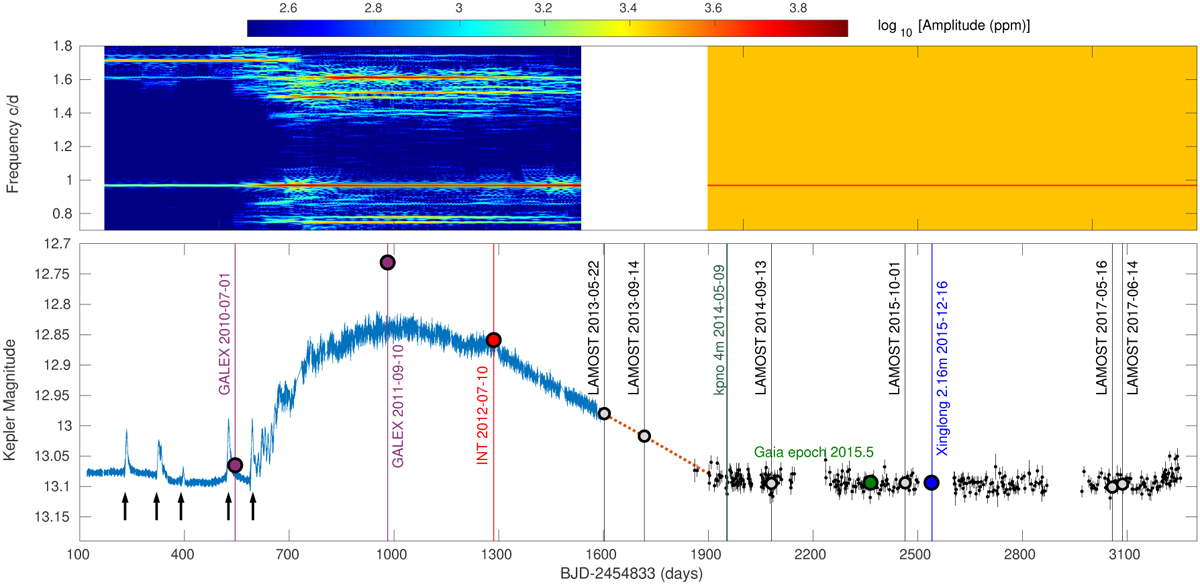
Summary of the KIC 9715425 data and power spectra. Bottom: overview of data for KIC 9715425. The LCs obtained by the Kepler and ASAS-SN missions are shown as blue lines and black dots with 1σ error bars, respectively. The NUV magnitudes from GALEX and the optical ones from the Isaac Newton Telescope (INT), Gaia, and the Xinglong 2.16 m telescope are converted or re-scaled to Kmag (see details in Sect. 2) and overplotted as filled circles. The ordinate values of the seven spectra are arbitrarily set to match the Kmag values at the times of the spectroscopy. The Gaia data are based on multiple visits, but only an epoch of 2015.5 is given in the Gaia archive. The five MIBs before the MAB are indicated by the black arrows. The MAB reached a maximum flux increase of ~25% (~0.24 mag) on day 970 and lasted for ≥1000 d. Informative texts (telescope names and observing dates) for other data are inserted along the vertical lines at the corresponding times. Top: power spectra map showing frequencies with highest amplitudes at different stages. Left panel: Kepler observations. Right panel: ASAS-SN observations. We note that only one frequency was detected in the ASAS-SN LC due to the latter’s lower data quality. The PP ended around day 600, the MAB lasted from ~day 600 until presumably day 2000, when the QS began. The first TESS observations were obtained after day 3800 (Table 1) and are not plotted.
Current usage metrics show cumulative count of Article Views (full-text article views including HTML views, PDF and ePub downloads, according to the available data) and Abstracts Views on Vision4Press platform.
Data correspond to usage on the plateform after 2015. The current usage metrics is available 48-96 hours after online publication and is updated daily on week days.
Initial download of the metrics may take a while.