Fig. 7.
Download original image
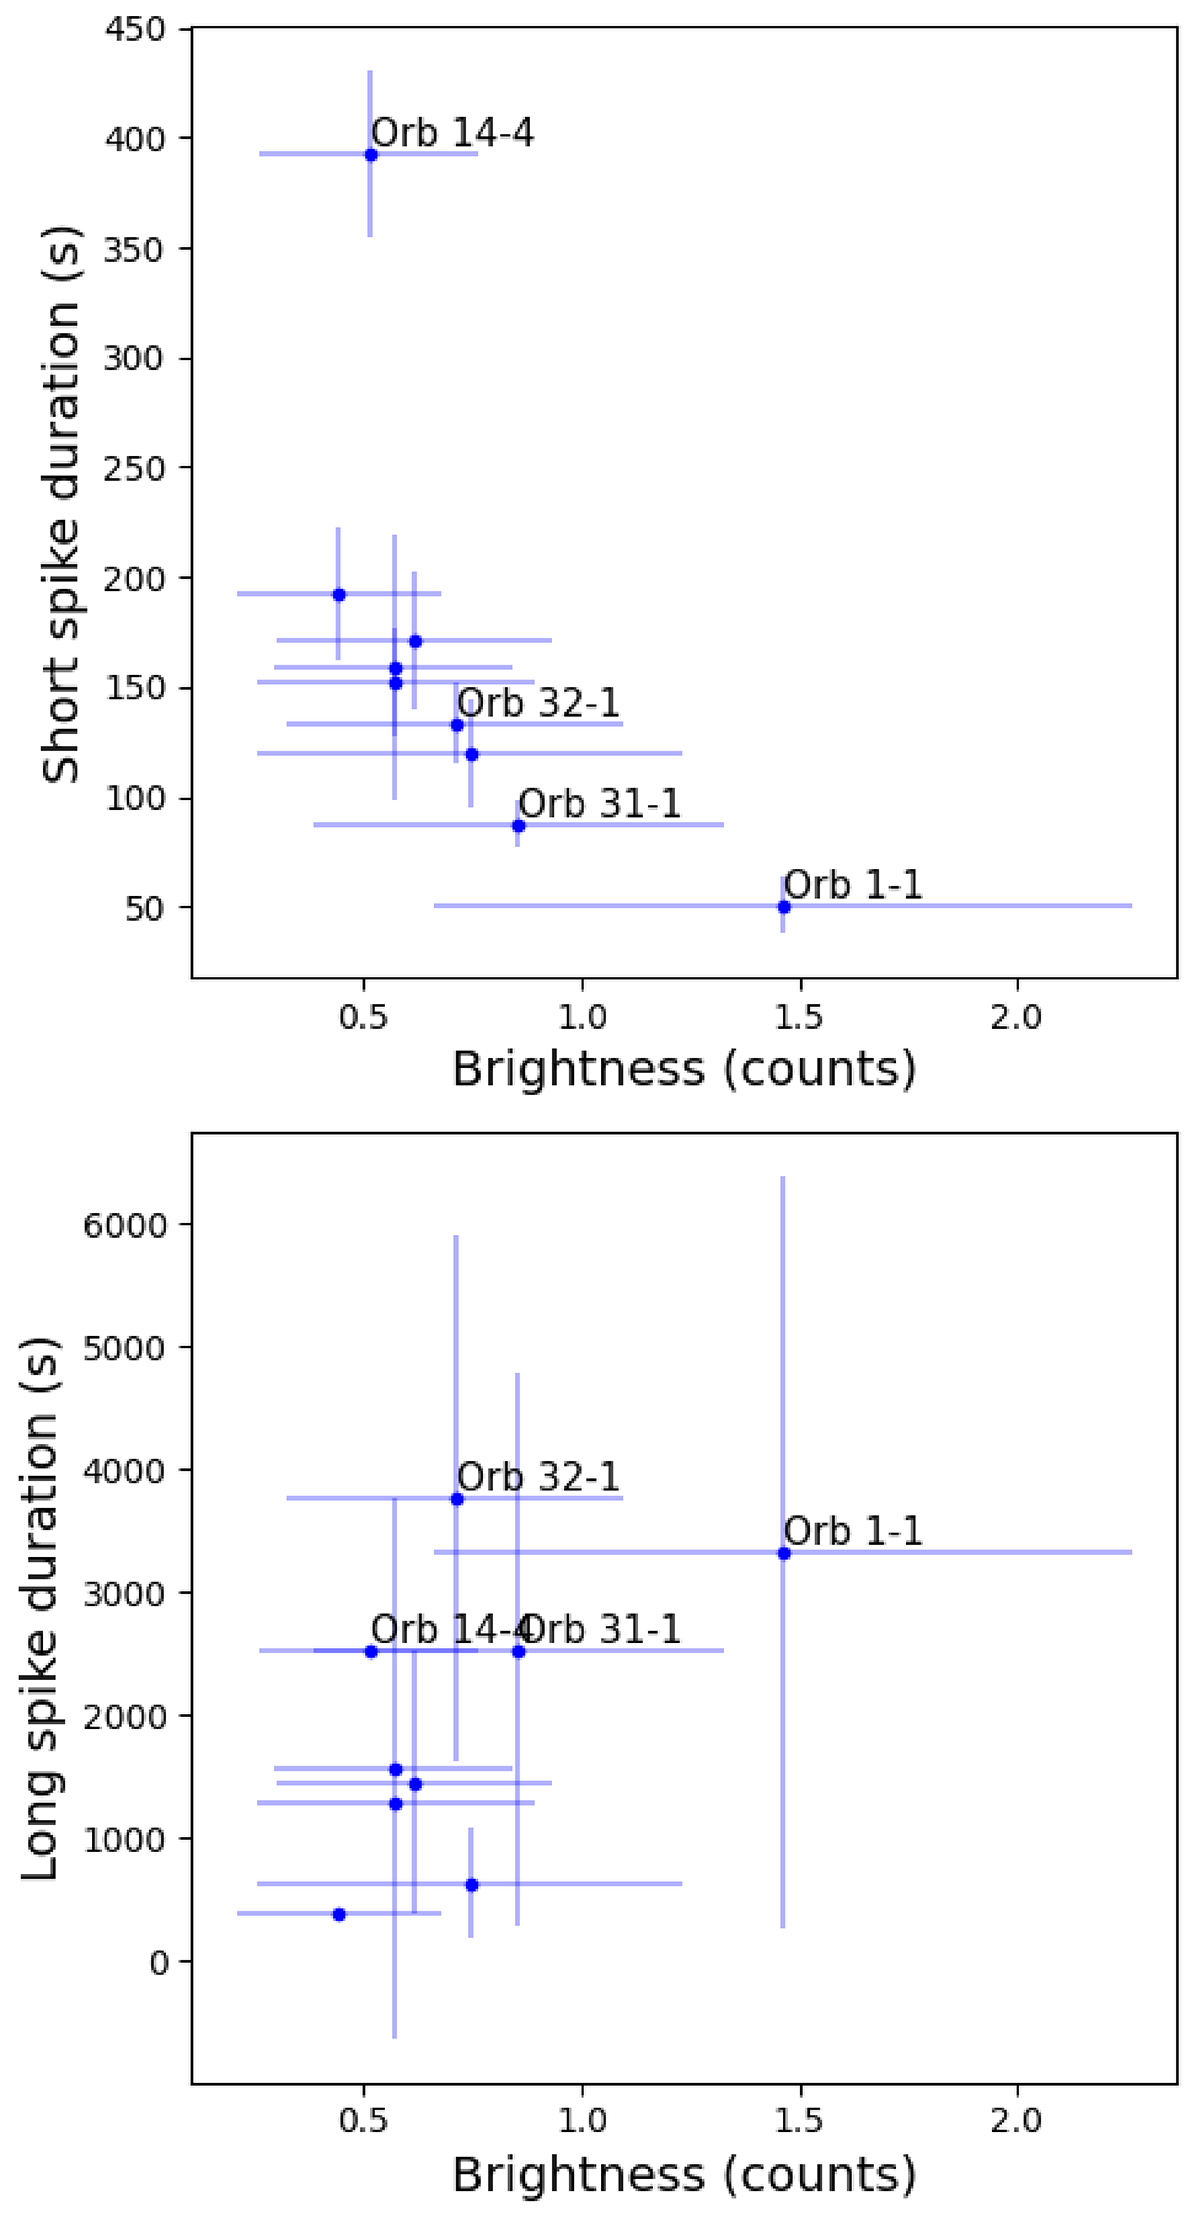
Average spike duration for each of the two clusters (with the upper panel displaying the short spikes and the lower panel displaying the long spikes) as predicted by the Gaussian mixture algorithm for each observation. The x-axis represents the brightness of each observation, measured as the error-weighted count average (whc).
Current usage metrics show cumulative count of Article Views (full-text article views including HTML views, PDF and ePub downloads, according to the available data) and Abstracts Views on Vision4Press platform.
Data correspond to usage on the plateform after 2015. The current usage metrics is available 48-96 hours after online publication and is updated daily on week days.
Initial download of the metrics may take a while.