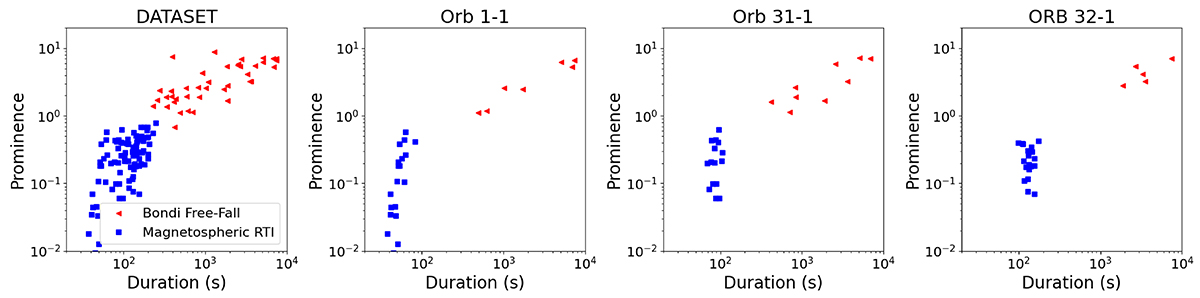
Fig. 6.
Download original image
Prominence vs. duration of spikes detected in this dataset. The blue squares and red triangles represent the two separated clusters obtained by a Gaussian mixture algorithm. The leftmost panel provides the results obtained for all the observations combined, while the three panels on the right display the results for the three individual observations that produced the better results in number of spikes detected, and thus in clustering.
Current usage metrics show cumulative count of Article Views (full-text article views including HTML views, PDF and ePub downloads, according to the available data) and Abstracts Views on Vision4Press platform.
Data correspond to usage on the plateform after 2015. The current usage metrics is available 48-96 hours after online publication and is updated daily on week days.
Initial download of the metrics may take a while.