Open Access
Fig. 2.
Download original image
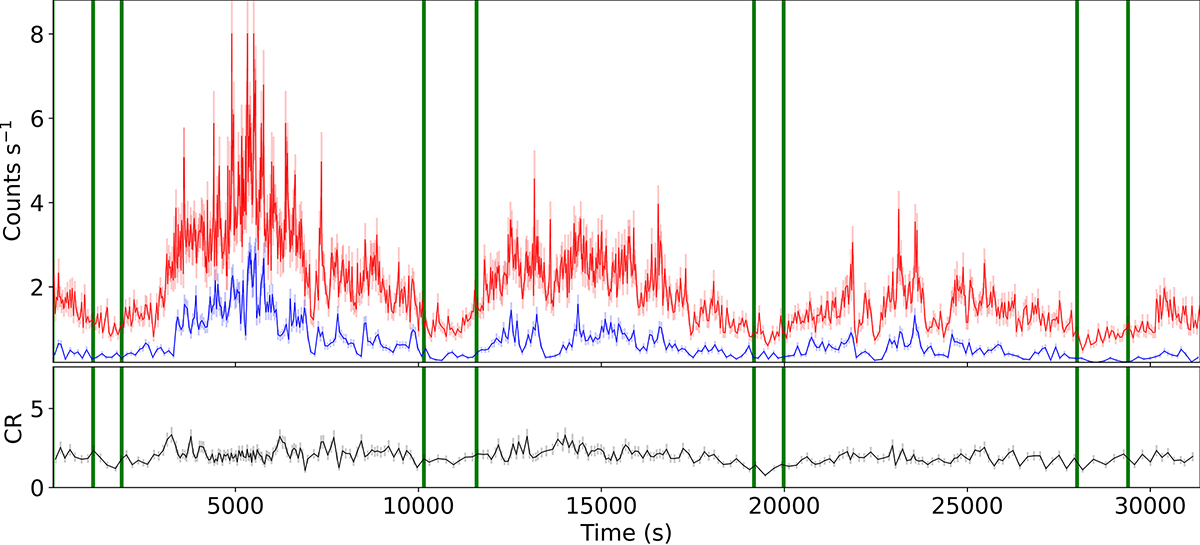
Example of peak and valley division on Orb 1-1. Upper panel: High-energy (3–10 keV, red) and low-energy (0.2–3 keV, blue) light curves. The vertical lines indicate the divisions between the peaks and valleys. Lower panel: Color ratio (CR), defined as the high-energy light curve divided by the low-energy light curve.
Current usage metrics show cumulative count of Article Views (full-text article views including HTML views, PDF and ePub downloads, according to the available data) and Abstracts Views on Vision4Press platform.
Data correspond to usage on the plateform after 2015. The current usage metrics is available 48-96 hours after online publication and is updated daily on week days.
Initial download of the metrics may take a while.