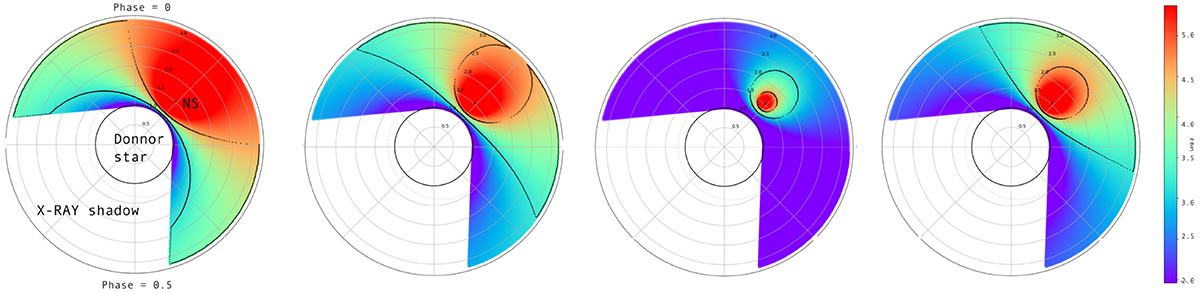
Fig. 12.
Download original image
Ionization map in the plane of the orbit: Shown (from left to right) are the Bright, Intermediate, Faint, and Absorbed spectra. The delimited regions represent the Fe Kα region, i.e., with an ionization parameter lower than 100 and higher than 25. We note that the orbital phase is ignored as the spectra are not phase-resolved. For visualization purposes, the orbital phase ϕ = 0.12 is used.
Current usage metrics show cumulative count of Article Views (full-text article views including HTML views, PDF and ePub downloads, according to the available data) and Abstracts Views on Vision4Press platform.
Data correspond to usage on the plateform after 2015. The current usage metrics is available 48-96 hours after online publication and is updated daily on week days.
Initial download of the metrics may take a while.