Open Access
Fig. 11.
Download original image
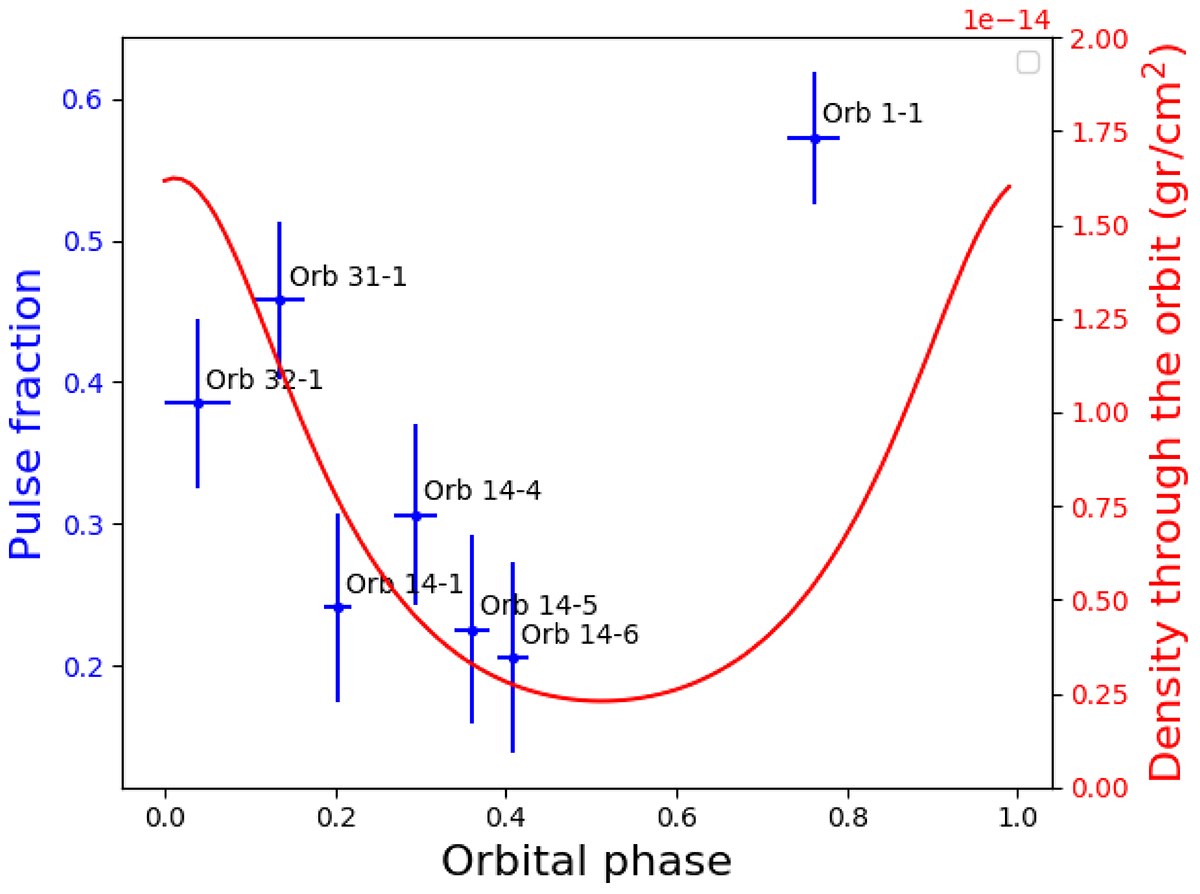
Density variation encountered by the NS as it travels around the eccentric orbit (red continuous line). The measured pulse fraction (Table 3) might be correlated with the density of the NS environment.
Current usage metrics show cumulative count of Article Views (full-text article views including HTML views, PDF and ePub downloads, according to the available data) and Abstracts Views on Vision4Press platform.
Data correspond to usage on the plateform after 2015. The current usage metrics is available 48-96 hours after online publication and is updated daily on week days.
Initial download of the metrics may take a while.