Fig. 9.
Download original image
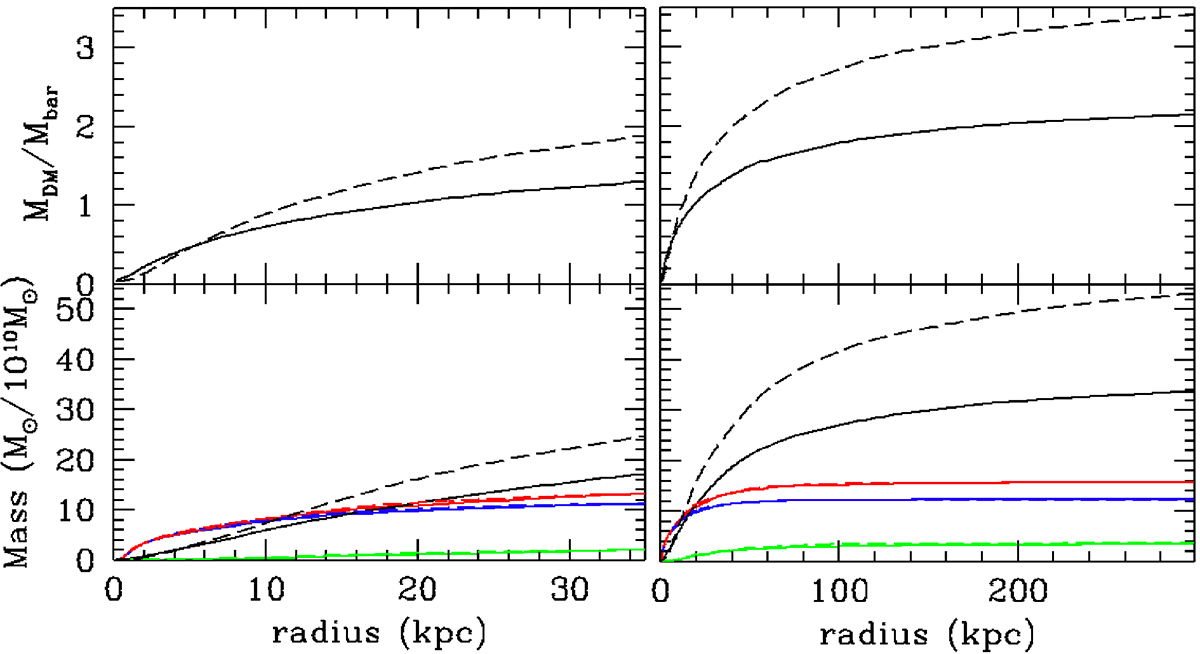
Radial distribution of DM and baryonic matter. The full lines show the radial DM distribution of model 371 (snapshot 680), within 35 kpc (left) and 300 kpc (right). Long-dashed lines give the same for model 288 and snapshot 762. Top panels: Ratio of MDM/Mbar versus radius. Bottom panels: Evolution of DM (black lines), baryon (red lines), stellar (blue lines), and gas (green lines) masses.
Current usage metrics show cumulative count of Article Views (full-text article views including HTML views, PDF and ePub downloads, according to the available data) and Abstracts Views on Vision4Press platform.
Data correspond to usage on the plateform after 2015. The current usage metrics is available 48-96 hours after online publication and is updated daily on week days.
Initial download of the metrics may take a while.