Fig. 6.
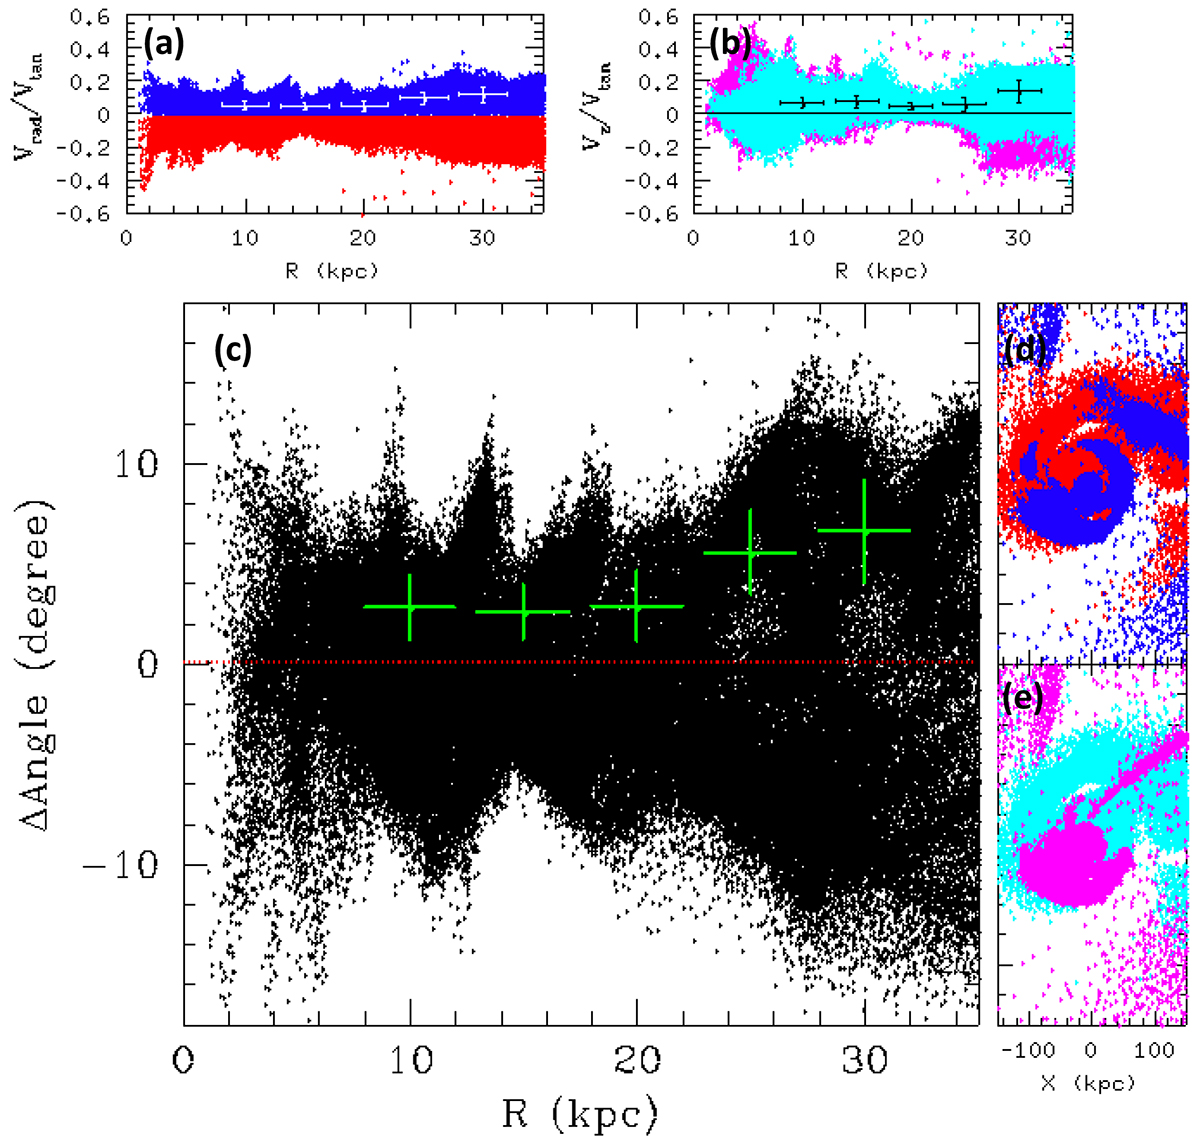
Download original image
Oscillation behavior of gas particles in the merger model 371 and snapshot 680 (i.e., 2.6 Gyr after the merger). Panels a and b give the ratio of the radial (and azimuthal) velocities to tangential velocities, respectively. In both panels, points and error bars give the median of the absolute values at five different radii. The colors in panel b indicate whether ΔAngle is negative (magenta) or positive (cyan). Panel c shows the radial evolution of ΔAngle, which is the difference between the disk-projected velocity vector and that of a pure circular motion. Points and error bars give the median of the absolute values at five different radii. Panels d and e provide the gas particle distribution within 300 × 600 kpc2 and show the presence of a tidal tail on the right sides whose angular momentum is slightly tilted versus that of the remnant disk. The colors are the same as in panels a and b, respectively.
Current usage metrics show cumulative count of Article Views (full-text article views including HTML views, PDF and ePub downloads, according to the available data) and Abstracts Views on Vision4Press platform.
Data correspond to usage on the plateform after 2015. The current usage metrics is available 48-96 hours after online publication and is updated daily on week days.
Initial download of the metrics may take a while.